French Canadian vs Immigrants from Uganda Poverty
COMPARE
French Canadian
Immigrants from Uganda
Poverty
Poverty Comparison
French Canadians
Immigrants from Uganda
11.6%
POVERTY
91.0/ 100
METRIC RATING
111th/ 347
METRIC RANK
12.8%
POVERTY
16.5/ 100
METRIC RATING
201st/ 347
METRIC RANK
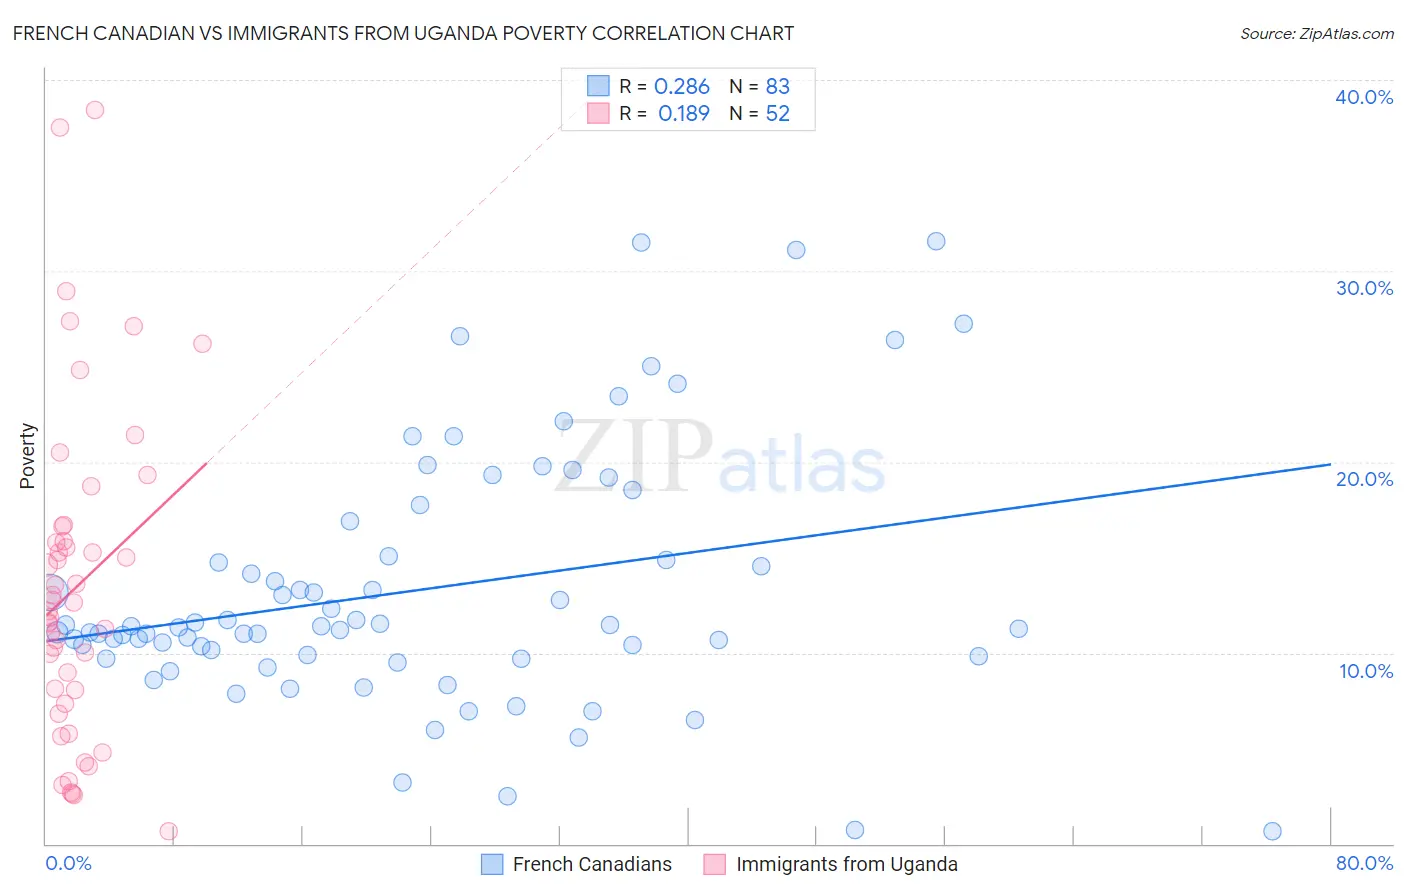
French Canadian vs Immigrants from Uganda Poverty Correlation Chart
The statistical analysis conducted on geographies consisting of 502,211,905 people shows a weak positive correlation between the proportion of French Canadians and poverty level in the United States with a correlation coefficient (R) of 0.286 and weighted average of 11.6%. Similarly, the statistical analysis conducted on geographies consisting of 125,970,249 people shows a poor positive correlation between the proportion of Immigrants from Uganda and poverty level in the United States with a correlation coefficient (R) of 0.189 and weighted average of 12.8%, a difference of 10.1%.
Poverty Correlation Summary
| Measurement | French Canadian | Immigrants from Uganda |
| Minimum | 0.65% | 0.63% |
| Maximum | 31.6% | 38.4% |
| Range | 30.9% | 37.8% |
| Mean | 13.3% | 13.5% |
| Median | 11.3% | 12.4% |
| Interquartile 25% (IQ1) | 9.8% | 7.7% |
| Interquartile 75% (IQ3) | 15.1% | 16.2% |
| Interquartile Range (IQR) | 5.3% | 8.6% |
| Standard Deviation (Sample) | 6.6% | 8.5% |
| Standard Deviation (Population) | 6.5% | 8.4% |
Similar Demographics by Poverty
Demographics Similar to French Canadians by Poverty
In terms of poverty, the demographic groups most similar to French Canadians are Immigrants from Southern Europe (11.6%, a difference of 0.070%), Immigrants from Belarus (11.6%, a difference of 0.070%), Immigrants from China (11.6%, a difference of 0.090%), Welsh (11.6%, a difference of 0.17%), and Immigrants from Turkey (11.6%, a difference of 0.21%).
| Demographics | Rating | Rank | Poverty |
| Native Hawaiians | 92.1 /100 | #104 | Exceptional 11.6% |
| Portuguese | 92.1 /100 | #105 | Exceptional 11.6% |
| Immigrants | Zimbabwe | 92.1 /100 | #106 | Exceptional 11.6% |
| Palestinians | 91.8 /100 | #107 | Exceptional 11.6% |
| Canadians | 91.7 /100 | #108 | Exceptional 11.6% |
| Immigrants | Turkey | 91.7 /100 | #109 | Exceptional 11.6% |
| Welsh | 91.6 /100 | #110 | Exceptional 11.6% |
| French Canadians | 91.0 /100 | #111 | Exceptional 11.6% |
| Immigrants | Southern Europe | 90.8 /100 | #112 | Exceptional 11.6% |
| Immigrants | Belarus | 90.8 /100 | #113 | Exceptional 11.6% |
| Immigrants | China | 90.7 /100 | #114 | Exceptional 11.6% |
| Albanians | 90.3 /100 | #115 | Exceptional 11.7% |
| Immigrants | Russia | 89.7 /100 | #116 | Excellent 11.7% |
| Sri Lankans | 89.4 /100 | #117 | Excellent 11.7% |
| Argentineans | 89.1 /100 | #118 | Excellent 11.7% |
Demographics Similar to Immigrants from Uganda by Poverty
In terms of poverty, the demographic groups most similar to Immigrants from Uganda are Spaniard (12.8%, a difference of 0.0%), Immigrants from Kenya (12.8%, a difference of 0.16%), Immigrants from Uruguay (12.8%, a difference of 0.16%), Hmong (12.8%, a difference of 0.26%), and Immigrants from Lebanon (12.8%, a difference of 0.35%).
| Demographics | Rating | Rank | Poverty |
| Arabs | 21.1 /100 | #194 | Fair 12.7% |
| Immigrants | Kuwait | 20.9 /100 | #195 | Fair 12.7% |
| Iraqis | 20.8 /100 | #196 | Fair 12.7% |
| Immigrants | Lebanon | 18.7 /100 | #197 | Poor 12.8% |
| Spanish | 18.7 /100 | #198 | Poor 12.8% |
| Immigrants | Kenya | 17.5 /100 | #199 | Poor 12.8% |
| Spaniards | 16.5 /100 | #200 | Poor 12.8% |
| Immigrants | Uganda | 16.5 /100 | #201 | Poor 12.8% |
| Immigrants | Uruguay | 15.6 /100 | #202 | Poor 12.8% |
| Hmong | 15.0 /100 | #203 | Poor 12.8% |
| Immigrants | Western Asia | 14.1 /100 | #204 | Poor 12.9% |
| Tsimshian | 9.2 /100 | #205 | Tragic 13.0% |
| Immigrants | Eastern Africa | 7.0 /100 | #206 | Tragic 13.1% |
| Panamanians | 6.6 /100 | #207 | Tragic 13.1% |
| Ugandans | 6.2 /100 | #208 | Tragic 13.1% |