French Canadian vs Immigrants from Kenya Female Poverty Among 18-24 Year Olds

COMPARE

French Canadian
Race
Ancestry
AfghanAfricanAlaska NativeAlaskan AthabascanAlbanianAleutAlsatianAmericanApacheArabArapahoArgentineanArmenianAssyrian/Chaldean/SyriacAustralianAustrianBahamianBangladeshiBarbadianBasqueBelgianBelizeanBermudanBhutaneseBlackfeetBolivianBrazilianBritishBritish West IndianBulgarianBurmeseCajunCambodianCanadianCape VerdeanCarpatho RusynCelticCentral AmericanCentral American IndianCherokeeCheyenneChickasawChileanChineseChippewaChoctawColombianColvilleComancheCosta RicanCreeCreekCroatianCrowCubanCypriotCzechCzechoslovakianDanishDelawareDominicanDutchDutch West IndianEastern EuropeanEcuadorianEgyptianEnglishEstonianEthiopianEuropeanFijianFilipinoFinnishFrenchFrench American IndianFrench CanadianGermanGerman RussianGhanaianGreekGuamanian/ChamorroGuatemalanGuyaneseHaitianHmongHonduranHopiHoumaHungarianIcelanderIndian (Asian)IndonesianInupiatIranianIraqiIrishIroquoisIsraeliItalianJamaicanJapaneseJordanianKenyanKiowaKoreanLaotianLatvianLebaneseLiberianLithuanianLumbeeLuxembourgerMacedonianMalaysianMalteseMarshalleseMenomineeMexicanMexican American IndianMongolianMoroccanNative HawaiianNavajoNepaleseNew ZealanderNicaraguanNigerianNorthern EuropeanNorwegianOkinawanOsageOttawaPaiutePakistaniPalestinianPanamanianParaguayanPennsylvania GermanPeruvianPimaPolishPortuguesePotawatomiPuebloPuerto RicanPuget Sound SalishRomanianRussianSalvadoranSamoanScandinavianScotch-IrishScottishSeminoleSenegaleseSerbianShoshoneSierra LeoneanSiouxSlavicSlovakSloveneSomaliSouth AfricanSouth AmericanSouth American IndianSoviet UnionSpaniardSpanishSpanish AmericanSpanish American IndianSri LankanSubsaharan AfricanSudaneseSwedishSwissSyrianTaiwaneseThaiTlingit-HaidaTohono O'OdhamTonganTrinidadian and TobagonianTsimshianTurkishU.S. Virgin IslanderUgandanUkrainianUruguayanUteVenezuelanVietnameseWelshWest IndianYakamaYaquiYugoslavianYumanYup'ikZimbabwean
Immigration
NonimmigrantsImmigrantsAfghanistanAfricaAlbaniaArgentinaArmeniaAsiaAustraliaAustriaBahamasBangladeshBarbadosBelarusBelgiumBelizeBoliviaBosnia and HerzegovinaBrazilBulgariaBurma/MyanmarCabo VerdeCambodiaCameroonCanadaCaribbeanCentral AmericaChileChinaColombiaCongoCosta RicaCroatiaCubaCzechoslovakiaDenmarkDominicaDominican RepublicEastern AfricaEastern AsiaEastern EuropeEcuadorEgyptEl SalvadorEnglandEritreaEthiopiaEuropeFijiFranceGermanyGhanaGreeceGrenadaGuatemalaGuyanaHaitiHondurasHong KongHungaryIndiaIndonesiaIranIraqIrelandIsraelItalyJamaicaJapanJordanKazakhstanKoreaKuwaitLaosLatin AmericaLatviaLebanonLiberiaLithuaniaMalaysiaMexicoMicronesiaMiddle AfricaMoldovaMoroccoNepalNetherlandsNicaraguaNigeriaNorth AmericaNorth MacedoniaNorthern AfricaNorthern EuropeNorwayOceaniaPakistanPanamaPeruPhilippinesPolandPortugalRomaniaRussiaSaudi ArabiaScotlandSenegalSerbiaSierra LeoneSingaporeSomaliaSouth AfricaSouth AmericaSouth Central AsiaSouth Eastern AsiaSouthern EuropeSpainSri LankaSt. Vincent and the GrenadinesSudanSwedenSwitzerlandSyriaTaiwanThailandTrinidad and TobagoTurkeyUgandaUkraineUruguayUzbekistanVenezuelaVietnamWest IndiesWestern AfricaWestern AsiaWestern EuropeYemenZaireZimbabweAzores
Immigrants from Kenya
Race
Ancestry
AfghanAfricanAlaska NativeAlaskan AthabascanAlbanianAleutAlsatianAmericanApacheArabArapahoArgentineanArmenianAssyrian/Chaldean/SyriacAustralianAustrianBahamianBangladeshiBarbadianBasqueBelgianBelizeanBermudanBhutaneseBlackfeetBolivianBrazilianBritishBritish West IndianBulgarianBurmeseCajunCambodianCanadianCape VerdeanCarpatho RusynCelticCentral AmericanCentral American IndianCherokeeCheyenneChickasawChileanChineseChippewaChoctawColombianColvilleComancheCosta RicanCreeCreekCroatianCrowCubanCypriotCzechCzechoslovakianDanishDelawareDominicanDutchDutch West IndianEastern EuropeanEcuadorianEgyptianEnglishEstonianEthiopianEuropeanFijianFilipinoFinnishFrenchFrench American IndianGermanGerman RussianGhanaianGreekGuamanian/ChamorroGuatemalanGuyaneseHaitianHmongHonduranHopiHoumaHungarianIcelanderIndian (Asian)IndonesianInupiatIranianIraqiIrishIroquoisIsraeliItalianJamaicanJapaneseJordanianKenyanKiowaKoreanLaotianLatvianLebaneseLiberianLithuanianLumbeeLuxembourgerMacedonianMalaysianMalteseMarshalleseMenomineeMexicanMexican American IndianMongolianMoroccanNative HawaiianNavajoNepaleseNew ZealanderNicaraguanNigerianNorthern EuropeanNorwegianOkinawanOsageOttawaPaiutePakistaniPalestinianPanamanianParaguayanPennsylvania GermanPeruvianPimaPolishPortuguesePotawatomiPuebloPuerto RicanPuget Sound SalishRomanianRussianSalvadoranSamoanScandinavianScotch-IrishScottishSeminoleSenegaleseSerbianShoshoneSierra LeoneanSiouxSlavicSlovakSloveneSomaliSouth AfricanSouth AmericanSouth American IndianSoviet UnionSpaniardSpanishSpanish AmericanSpanish American IndianSri LankanSubsaharan AfricanSudaneseSwedishSwissSyrianTaiwaneseThaiTlingit-HaidaTohono O'OdhamTonganTrinidadian and TobagonianTsimshianTurkishU.S. Virgin IslanderUgandanUkrainianUruguayanUteVenezuelanVietnameseWelshWest IndianYakamaYaquiYugoslavianYumanYup'ikZimbabwean
Immigration
NonimmigrantsImmigrantsAfghanistanAfricaAlbaniaArgentinaArmeniaAsiaAustraliaAustriaBahamasBangladeshBarbadosBelarusBelgiumBelizeBoliviaBosnia and HerzegovinaBrazilBulgariaBurma/MyanmarCabo VerdeCambodiaCameroonCanadaCaribbeanCentral AmericaChileChinaColombiaCongoCosta RicaCroatiaCubaCzechoslovakiaDenmarkDominicaDominican RepublicEastern AfricaEastern AsiaEastern EuropeEcuadorEgyptEl SalvadorEnglandEritreaEthiopiaEuropeFijiFranceGermanyGhanaGreeceGrenadaGuatemalaGuyanaHaitiHondurasHong KongHungaryIndiaIndonesiaIranIraqIrelandIsraelItalyJamaicaJapanJordanKazakhstanKenyaKoreaKuwaitLaosLatin AmericaLatviaLebanonLiberiaLithuaniaMalaysiaMexicoMicronesiaMiddle AfricaMoldovaMoroccoNepalNetherlandsNicaraguaNigeriaNorth AmericaNorth MacedoniaNorthern AfricaNorthern EuropeNorwayOceaniaPakistanPanamaPeruPhilippinesPolandPortugalRomaniaRussiaSaudi ArabiaScotlandSenegalSerbiaSierra LeoneSingaporeSomaliaSouth AfricaSouth AmericaSouth Central AsiaSouth Eastern AsiaSouthern EuropeSpainSri LankaSt. Vincent and the GrenadinesSudanSwedenSwitzerlandSyriaTaiwanThailandTrinidad and TobagoTurkeyUgandaUkraineUruguayUzbekistanVenezuelaVietnamWest IndiesWestern AfricaWestern AsiaWestern EuropeYemenZaireZimbabweAzores
Female Poverty Among 18-24 Year Olds
Income
Poverty
Unemployment
Labor Participation
Family Structure
Vehicle Availability
Education Level
Disability

Female Poverty Among 18-24 Year Olds Comparison

French Canadians

Immigrants from Kenya

Good
Tragic
19.9%
FEMALE POVERTY AMONG 18-24 YEAR OLDS
73.0/ 100
METRIC RATING
162nd/ 347
METRIC RANK
21.0%
FEMALE POVERTY AMONG 18-24 YEAR OLDS
2.5/ 100
METRIC RATING
248th/ 347
METRIC RANK

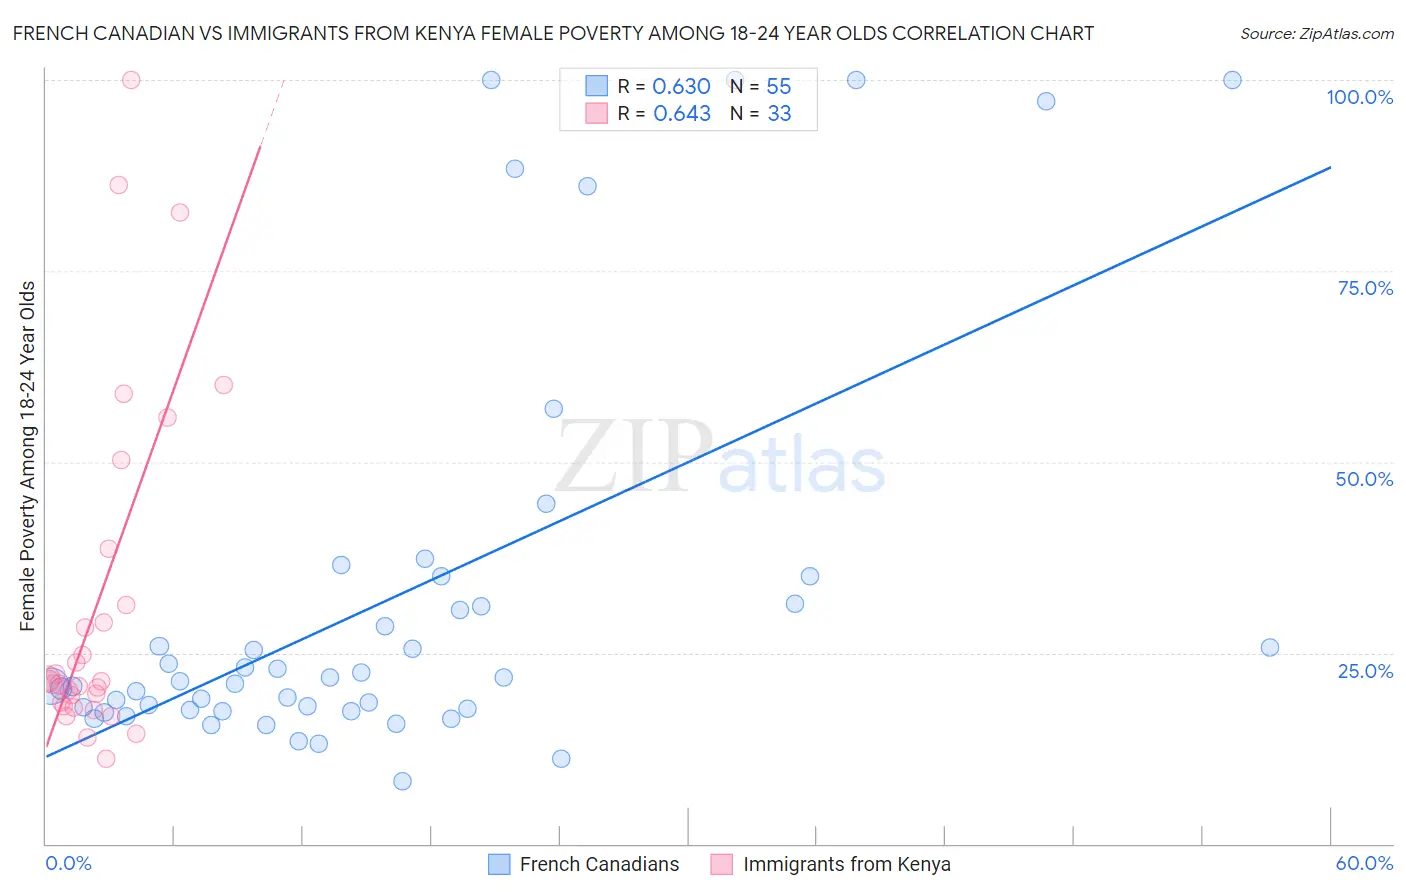
French Canadian vs Immigrants from Kenya Female Poverty Among 18-24 Year Olds Correlation Chart

The statistical analysis conducted on geographies consisting of 479,685,705 people shows a significant positive correlation between the proportion of French Canadians and poverty level among females between the ages 18 and 24 in the United States with a correlation coefficient (R) of 0.630 and weighted average of 19.9%. Similarly, the statistical analysis conducted on geographies consisting of 215,781,143 people shows a significant positive correlation between the proportion of Immigrants from Kenya and poverty level among females between the ages 18 and 24 in the United States with a correlation coefficient (R) of 0.643 and weighted average of 21.0%, a difference of 5.8%.
French Canadian vs Immigrants from Kenya Female Poverty Among 18-24 Year Olds

Female Poverty Among 18-24 Year Olds Correlation Summary

MeasurementFrench CanadianImmigrants from Kenya
Minimum8.2%11.2%
Maximum100.0%100.0%
Range91.8%88.8%
Mean32.0%31.6%
Median21.3%21.2%
Interquartile 25% (IQ1)17.5%18.2%
Interquartile 75% (IQ3)31.3%35.0%
Interquartile Range (IQR)13.9%16.7%
Standard Deviation (Sample)26.1%22.7%
Standard Deviation (Population)25.9%22.3%

Similar Demographics by Female Poverty Among 18-24 Year Olds

Demographics Similar to French Canadians by Female Poverty Among 18-24 Year Olds

In terms of female poverty among 18-24 year olds, the demographic groups most similar to French Canadians are Malaysian (19.9%, a difference of 0.020%), Pakistani (19.8%, a difference of 0.070%), Immigrants from Belize (19.8%, a difference of 0.070%), Trinidadian and Tobagonian (19.8%, a difference of 0.090%), and Immigrants from Lebanon (19.8%, a difference of 0.15%).
DemographicsRating | RankFemale Poverty Among 18-24 Year Olds
Hungarians
76.6
/100
|
#155
Good
19.8%
Immigrants | Belgium
76.4
/100
|
#156
Good
19.8%
Danes
75.5
/100
|
#157
Good
19.8%
Immigrants | Lebanon
75.3
/100
|
#158
Good
19.8%
Trinidadians and Tobagonians
74.4
/100
|
#159
Good
19.8%
Pakistanis
74.1
/100
|
#160
Good
19.8%
Immigrants | Belize
74.1
/100
|
#161
Good
19.8%
French Canadians
73.0
/100
|
#162
Good
19.9%
Malaysians
72.7
/100
|
#163
Good
19.9%
Central Americans
70.0
/100
|
#164
Good
19.9%
Eastern Europeans
69.3
/100
|
#165
Good
19.9%
Belgians
69.1
/100
|
#166
Good
19.9%
Czechoslovakians
61.8
/100
|
#167
Good
20.0%
Fijians
59.1
/100
|
#168
Average
20.0%
Hmong
55.4
/100
|
#169
Average
20.0%

Demographics Similar to Immigrants from Kenya by Female Poverty Among 18-24 Year Olds

In terms of female poverty among 18-24 year olds, the demographic groups most similar to Immigrants from Kenya are Carpatho Rusyn (21.0%, a difference of 0.020%), Immigrants from West Indies (21.0%, a difference of 0.15%), Immigrants from Africa (21.0%, a difference of 0.20%), Immigrants from Australia (20.9%, a difference of 0.25%), and Aleut (20.9%, a difference of 0.33%).
DemographicsRating | RankFemale Poverty Among 18-24 Year Olds
Immigrants | Eritrea
4.2
/100
|
#241
Tragic
20.9%
Israelis
4.1
/100
|
#242
Tragic
20.9%
Marshallese
3.4
/100
|
#243
Tragic
20.9%
Immigrants | Thailand
3.4
/100
|
#244
Tragic
20.9%
Aleuts
3.3
/100
|
#245
Tragic
20.9%
Immigrants | Australia
3.1
/100
|
#246
Tragic
20.9%
Immigrants | Africa
3.0
/100
|
#247
Tragic
21.0%
Immigrants | Kenya
2.5
/100
|
#248
Tragic
21.0%
Carpatho Rusyns
2.5
/100
|
#249
Tragic
21.0%
Immigrants | West Indies
2.2
/100
|
#250
Tragic
21.0%
West Indians
1.9
/100
|
#251
Tragic
21.1%
South Africans
1.6
/100
|
#252
Tragic
21.1%
Delaware
1.6
/100
|
#253
Tragic
21.1%
British West Indians
1.2
/100
|
#254
Tragic
21.2%
Immigrants | Grenada
1.2
/100
|
#255
Tragic
21.2%