French Canadian vs Eastern European Male Poverty
COMPARE
French Canadian
Eastern European
Male Poverty
Male Poverty Comparison
French Canadians
Eastern Europeans
10.5%
MALE POVERTY
91.9/ 100
METRIC RATING
102nd/ 347
METRIC RANK
9.6%
MALE POVERTY
99.6/ 100
METRIC RATING
25th/ 347
METRIC RANK
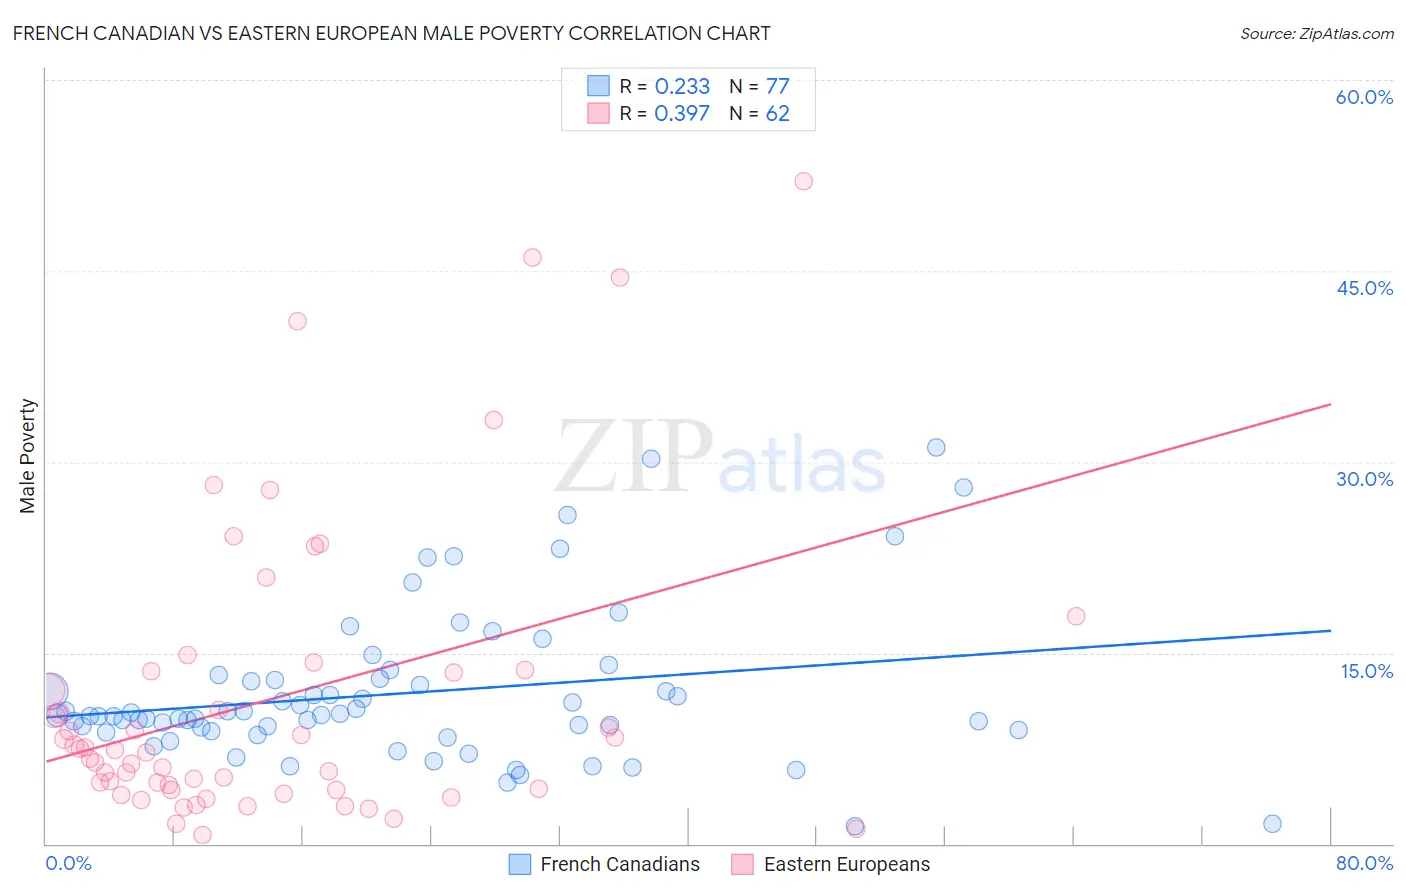
French Canadian vs Eastern European Male Poverty Correlation Chart
The statistical analysis conducted on geographies consisting of 501,843,843 people shows a weak positive correlation between the proportion of French Canadians and poverty level among males in the United States with a correlation coefficient (R) of 0.233 and weighted average of 10.5%. Similarly, the statistical analysis conducted on geographies consisting of 460,627,341 people shows a mild positive correlation between the proportion of Eastern Europeans and poverty level among males in the United States with a correlation coefficient (R) of 0.397 and weighted average of 9.6%, a difference of 9.1%.
Male Poverty Correlation Summary
| Measurement | French Canadian | Eastern European |
| Minimum | 1.4% | 0.67% |
| Maximum | 31.1% | 52.0% |
| Range | 29.8% | 51.3% |
| Mean | 11.8% | 11.4% |
| Median | 10.1% | 7.3% |
| Interquartile 25% (IQ1) | 8.9% | 4.3% |
| Interquartile 75% (IQ3) | 12.9% | 13.5% |
| Interquartile Range (IQR) | 4.0% | 9.3% |
| Standard Deviation (Sample) | 5.9% | 11.6% |
| Standard Deviation (Population) | 5.9% | 11.5% |
Similar Demographics by Male Poverty
Demographics Similar to French Canadians by Male Poverty
In terms of male poverty, the demographic groups most similar to French Canadians are Immigrants from Zimbabwe (10.5%, a difference of 0.010%), Slavic (10.5%, a difference of 0.10%), Welsh (10.5%, a difference of 0.11%), Canadian (10.5%, a difference of 0.12%), and Immigrants from Southern Europe (10.5%, a difference of 0.23%).
| Demographics | Rating | Rank | Male Poverty |
| Scottish | 94.0 /100 | #95 | Exceptional 10.4% |
| Immigrants | Egypt | 93.7 /100 | #96 | Exceptional 10.4% |
| Romanians | 93.6 /100 | #97 | Exceptional 10.5% |
| Finns | 93.4 /100 | #98 | Exceptional 10.5% |
| Immigrants | Indonesia | 93.3 /100 | #99 | Exceptional 10.5% |
| Immigrants | Latvia | 92.8 /100 | #100 | Exceptional 10.5% |
| Immigrants | Zimbabwe | 92.0 /100 | #101 | Exceptional 10.5% |
| French Canadians | 91.9 /100 | #102 | Exceptional 10.5% |
| Slavs | 91.7 /100 | #103 | Exceptional 10.5% |
| Welsh | 91.6 /100 | #104 | Exceptional 10.5% |
| Canadians | 91.6 /100 | #105 | Exceptional 10.5% |
| Immigrants | Southern Europe | 91.3 /100 | #106 | Exceptional 10.5% |
| Laotians | 91.2 /100 | #107 | Exceptional 10.5% |
| Portuguese | 91.0 /100 | #108 | Exceptional 10.6% |
| Albanians | 90.6 /100 | #109 | Exceptional 10.6% |
Demographics Similar to Eastern Europeans by Male Poverty
In terms of male poverty, the demographic groups most similar to Eastern Europeans are Swedish (9.6%, a difference of 0.14%), Italian (9.6%, a difference of 0.22%), Croatian (9.6%, a difference of 0.23%), Burmese (9.7%, a difference of 0.44%), and Immigrants from Scotland (9.6%, a difference of 0.48%).
| Demographics | Rating | Rank | Male Poverty |
| Lithuanians | 99.8 /100 | #18 | Exceptional 9.5% |
| Immigrants | Hong Kong | 99.7 /100 | #19 | Exceptional 9.6% |
| Latvians | 99.7 /100 | #20 | Exceptional 9.6% |
| Immigrants | Scotland | 99.7 /100 | #21 | Exceptional 9.6% |
| Croatians | 99.7 /100 | #22 | Exceptional 9.6% |
| Italians | 99.7 /100 | #23 | Exceptional 9.6% |
| Swedes | 99.7 /100 | #24 | Exceptional 9.6% |
| Eastern Europeans | 99.6 /100 | #25 | Exceptional 9.6% |
| Burmese | 99.6 /100 | #26 | Exceptional 9.7% |
| Danes | 99.6 /100 | #27 | Exceptional 9.7% |
| Immigrants | Korea | 99.6 /100 | #28 | Exceptional 9.7% |
| Greeks | 99.6 /100 | #29 | Exceptional 9.7% |
| Poles | 99.5 /100 | #30 | Exceptional 9.7% |
| Tongans | 99.5 /100 | #31 | Exceptional 9.7% |
| Macedonians | 99.5 /100 | #32 | Exceptional 9.7% |