French American Indian vs Pima Single Male Poverty
COMPARE
French American Indian
Pima
Single Male Poverty
Single Male Poverty Comparison
French American Indians
Pima
15.0%
SINGLE MALE POVERTY
0.0/ 100
METRIC RATING
298th/ 347
METRIC RANK
20.2%
SINGLE MALE POVERTY
0.0/ 100
METRIC RATING
334th/ 347
METRIC RANK
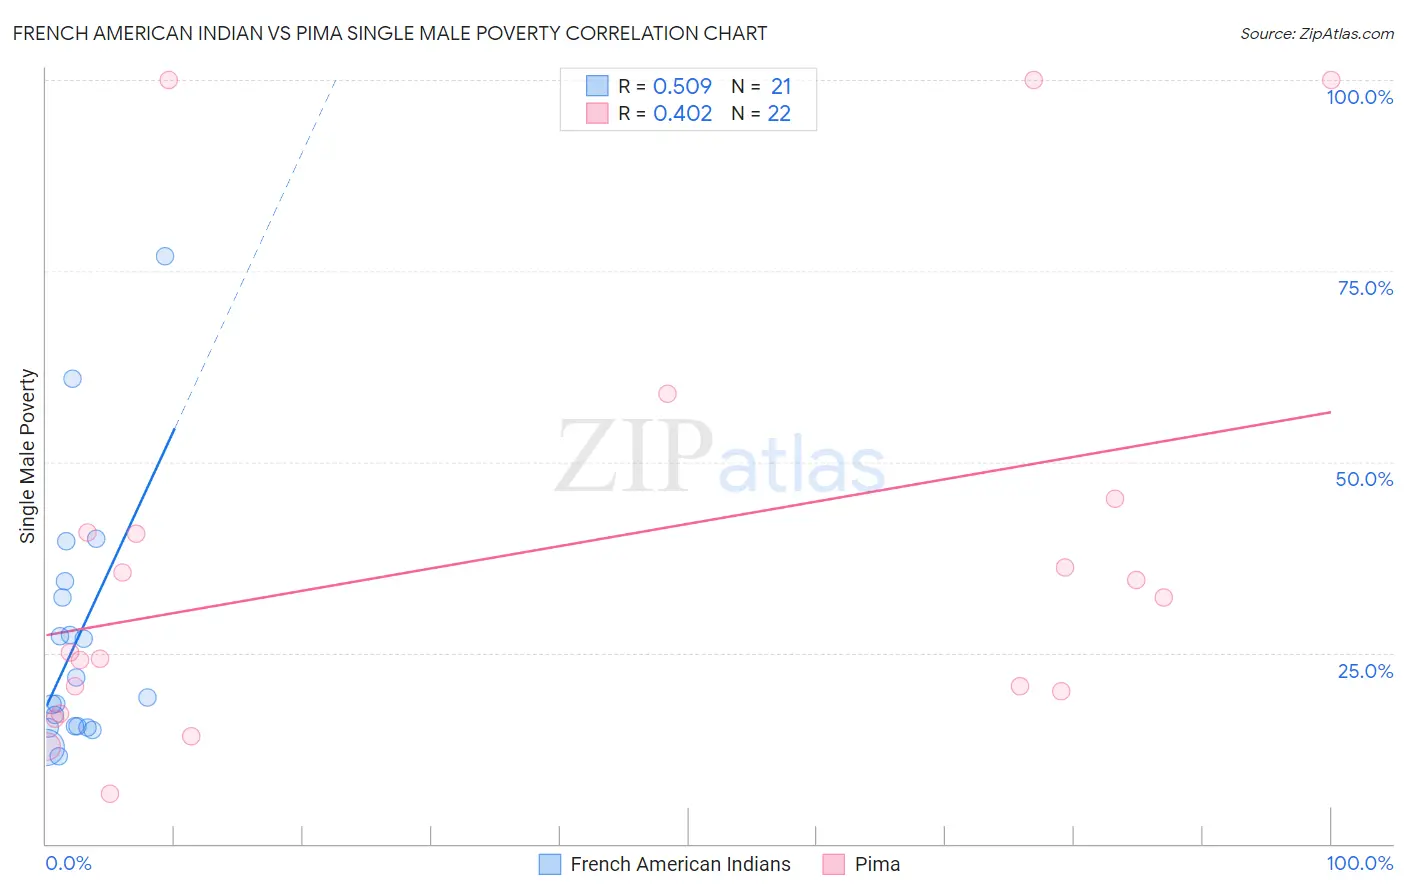
French American Indian vs Pima Single Male Poverty Correlation Chart
The statistical analysis conducted on geographies consisting of 125,004,458 people shows a substantial positive correlation between the proportion of French American Indians and poverty level among single males in the United States with a correlation coefficient (R) of 0.509 and weighted average of 15.0%. Similarly, the statistical analysis conducted on geographies consisting of 60,152,261 people shows a moderate positive correlation between the proportion of Pima and poverty level among single males in the United States with a correlation coefficient (R) of 0.402 and weighted average of 20.2%, a difference of 34.6%.
Single Male Poverty Correlation Summary
| Measurement | French American Indian | Pima |
| Minimum | 11.4% | 6.5% |
| Maximum | 76.9% | 100.0% |
| Range | 65.5% | 93.5% |
| Mean | 26.7% | 37.5% |
| Median | 19.2% | 28.6% |
| Interquartile 25% (IQ1) | 15.3% | 20.0% |
| Interquartile 75% (IQ3) | 33.3% | 40.7% |
| Interquartile Range (IQR) | 18.0% | 20.7% |
| Standard Deviation (Sample) | 16.6% | 28.2% |
| Standard Deviation (Population) | 16.2% | 27.5% |
Similar Demographics by Single Male Poverty
Demographics Similar to French American Indians by Single Male Poverty
In terms of single male poverty, the demographic groups most similar to French American Indians are Delaware (15.0%, a difference of 0.39%), Cree (15.1%, a difference of 0.84%), Immigrants from Dominican Republic (14.8%, a difference of 1.3%), African (14.7%, a difference of 1.6%), and Dominican (15.2%, a difference of 1.7%).
| Demographics | Rating | Rank | Single Male Poverty |
| Bahamians | 0.0 /100 | #291 | Tragic 14.6% |
| Immigrants | Nonimmigrants | 0.0 /100 | #292 | Tragic 14.6% |
| French Canadians | 0.0 /100 | #293 | Tragic 14.6% |
| Ottawa | 0.0 /100 | #294 | Tragic 14.6% |
| Scotch-Irish | 0.0 /100 | #295 | Tragic 14.7% |
| Africans | 0.0 /100 | #296 | Tragic 14.7% |
| Immigrants | Dominican Republic | 0.0 /100 | #297 | Tragic 14.8% |
| French American Indians | 0.0 /100 | #298 | Tragic 15.0% |
| Delaware | 0.0 /100 | #299 | Tragic 15.0% |
| Cree | 0.0 /100 | #300 | Tragic 15.1% |
| Dominicans | 0.0 /100 | #301 | Tragic 15.2% |
| Alsatians | 0.0 /100 | #302 | Tragic 15.2% |
| Aleuts | 0.0 /100 | #303 | Tragic 15.4% |
| Alaska Natives | 0.0 /100 | #304 | Tragic 15.4% |
| Blackfeet | 0.0 /100 | #305 | Tragic 15.5% |
Demographics Similar to Pima by Single Male Poverty
In terms of single male poverty, the demographic groups most similar to Pima are Inupiat (20.0%, a difference of 0.80%), Native/Alaskan (19.6%, a difference of 2.7%), Paiute (19.3%, a difference of 4.4%), Cajun (19.1%, a difference of 5.7%), and Yuman (21.3%, a difference of 5.7%).
| Demographics | Rating | Rank | Single Male Poverty |
| Menominee | 0.0 /100 | #327 | Tragic 17.7% |
| Kiowa | 0.0 /100 | #328 | Tragic 18.3% |
| Colville | 0.0 /100 | #329 | Tragic 18.4% |
| Cajuns | 0.0 /100 | #330 | Tragic 19.1% |
| Paiute | 0.0 /100 | #331 | Tragic 19.3% |
| Natives/Alaskans | 0.0 /100 | #332 | Tragic 19.6% |
| Inupiat | 0.0 /100 | #333 | Tragic 20.0% |
| Pima | 0.0 /100 | #334 | Tragic 20.2% |
| Yuman | 0.0 /100 | #335 | Tragic 21.3% |
| Tohono O'odham | 0.0 /100 | #336 | Tragic 21.6% |
| Apache | 0.0 /100 | #337 | Tragic 21.6% |
| Pueblo | 0.0 /100 | #338 | Tragic 21.6% |
| Arapaho | 0.0 /100 | #339 | Tragic 21.9% |
| Sioux | 0.0 /100 | #340 | Tragic 22.2% |
| Crow | 0.0 /100 | #341 | Tragic 23.3% |