French American Indian vs Nonimmigrants Seniors Poverty Over the Age of 75

COMPARE

French American Indian
Race
Ancestry
AfghanAfricanAlaska NativeAlaskan AthabascanAlbanianAleutAlsatianAmericanApacheArabArapahoArgentineanArmenianAssyrian/Chaldean/SyriacAustralianAustrianBahamianBangladeshiBarbadianBasqueBelgianBelizeanBermudanBhutaneseBlackfeetBolivianBrazilianBritishBritish West IndianBulgarianBurmeseCajunCambodianCanadianCape VerdeanCarpatho RusynCelticCentral AmericanCentral American IndianCherokeeCheyenneChickasawChileanChineseChippewaChoctawColombianColvilleComancheCosta RicanCreeCreekCroatianCrowCubanCypriotCzechCzechoslovakianDanishDelawareDominicanDutchDutch West IndianEastern EuropeanEcuadorianEgyptianEnglishEstonianEthiopianEuropeanFijianFilipinoFinnishFrenchFrench American IndianFrench CanadianGermanGerman RussianGhanaianGreekGuamanian/ChamorroGuatemalanGuyaneseHaitianHmongHonduranHopiHoumaHungarianIcelanderIndian (Asian)IndonesianInupiatIranianIraqiIrishIroquoisIsraeliItalianJamaicanJapaneseJordanianKenyanKiowaKoreanLaotianLatvianLebaneseLiberianLithuanianLumbeeLuxembourgerMacedonianMalaysianMalteseMarshalleseMenomineeMexicanMexican American IndianMongolianMoroccanNative HawaiianNavajoNepaleseNew ZealanderNicaraguanNigerianNorthern EuropeanNorwegianOkinawanOsageOttawaPaiutePakistaniPalestinianPanamanianParaguayanPennsylvania GermanPeruvianPimaPolishPortuguesePotawatomiPuebloPuerto RicanPuget Sound SalishRomanianRussianSalvadoranSamoanScandinavianScotch-IrishScottishSeminoleSenegaleseSerbianShoshoneSierra LeoneanSiouxSlavicSlovakSloveneSomaliSouth AfricanSouth AmericanSouth American IndianSoviet UnionSpaniardSpanishSpanish AmericanSpanish American IndianSri LankanSubsaharan AfricanSudaneseSwedishSwissSyrianTaiwaneseThaiTlingit-HaidaTohono O'OdhamTonganTrinidadian and TobagonianTsimshianTurkishU.S. Virgin IslanderUgandanUkrainianUruguayanUteVenezuelanVietnameseWelshWest IndianYakamaYaquiYugoslavianYumanYup'ikZimbabwean
Immigration
ImmigrantsAfghanistanAfricaAlbaniaArgentinaArmeniaAsiaAustraliaAustriaBahamasBangladeshBarbadosBelarusBelgiumBelizeBoliviaBosnia and HerzegovinaBrazilBulgariaBurma/MyanmarCabo VerdeCambodiaCameroonCanadaCaribbeanCentral AmericaChileChinaColombiaCongoCosta RicaCroatiaCubaCzechoslovakiaDenmarkDominicaDominican RepublicEastern AfricaEastern AsiaEastern EuropeEcuadorEgyptEl SalvadorEnglandEritreaEthiopiaEuropeFijiFranceGermanyGhanaGreeceGrenadaGuatemalaGuyanaHaitiHondurasHong KongHungaryIndiaIndonesiaIranIraqIrelandIsraelItalyJamaicaJapanJordanKazakhstanKenyaKoreaKuwaitLaosLatin AmericaLatviaLebanonLiberiaLithuaniaMalaysiaMexicoMicronesiaMiddle AfricaMoldovaMoroccoNepalNetherlandsNicaraguaNigeriaNorth AmericaNorth MacedoniaNorthern AfricaNorthern EuropeNorwayOceaniaPakistanPanamaPeruPhilippinesPolandPortugalRomaniaRussiaSaudi ArabiaScotlandSenegalSerbiaSierra LeoneSingaporeSomaliaSouth AfricaSouth AmericaSouth Central AsiaSouth Eastern AsiaSouthern EuropeSpainSri LankaSt. Vincent and the GrenadinesSudanSwedenSwitzerlandSyriaTaiwanThailandTrinidad and TobagoTurkeyUgandaUkraineUruguayUzbekistanVenezuelaVietnamWest IndiesWestern AfricaWestern AsiaWestern EuropeYemenZaireZimbabweAzores
Nonimmigrants
Race
Ancestry
AfghanAfricanAlaska NativeAlaskan AthabascanAlbanianAleutAlsatianAmericanApacheArabArapahoArgentineanArmenianAssyrian/Chaldean/SyriacAustralianAustrianBahamianBangladeshiBarbadianBasqueBelgianBelizeanBermudanBhutaneseBlackfeetBolivianBrazilianBritishBritish West IndianBulgarianBurmeseCajunCambodianCanadianCape VerdeanCarpatho RusynCelticCentral AmericanCentral American IndianCherokeeCheyenneChickasawChileanChineseChippewaChoctawColombianColvilleComancheCosta RicanCreeCreekCroatianCrowCubanCypriotCzechCzechoslovakianDanishDelawareDominicanDutchDutch West IndianEastern EuropeanEcuadorianEgyptianEnglishEstonianEthiopianEuropeanFijianFilipinoFinnishFrenchFrench CanadianGermanGerman RussianGhanaianGreekGuamanian/ChamorroGuatemalanGuyaneseHaitianHmongHonduranHopiHoumaHungarianIcelanderIndian (Asian)IndonesianInupiatIranianIraqiIrishIroquoisIsraeliItalianJamaicanJapaneseJordanianKenyanKiowaKoreanLaotianLatvianLebaneseLiberianLithuanianLumbeeLuxembourgerMacedonianMalaysianMalteseMarshalleseMenomineeMexicanMexican American IndianMongolianMoroccanNative HawaiianNavajoNepaleseNew ZealanderNicaraguanNigerianNorthern EuropeanNorwegianOkinawanOsageOttawaPaiutePakistaniPalestinianPanamanianParaguayanPennsylvania GermanPeruvianPimaPolishPortuguesePotawatomiPuebloPuerto RicanPuget Sound SalishRomanianRussianSalvadoranSamoanScandinavianScotch-IrishScottishSeminoleSenegaleseSerbianShoshoneSierra LeoneanSiouxSlavicSlovakSloveneSomaliSouth AfricanSouth AmericanSouth American IndianSoviet UnionSpaniardSpanishSpanish AmericanSpanish American IndianSri LankanSubsaharan AfricanSudaneseSwedishSwissSyrianTaiwaneseThaiTlingit-HaidaTohono O'OdhamTonganTrinidadian and TobagonianTsimshianTurkishU.S. Virgin IslanderUgandanUkrainianUruguayanUteVenezuelanVietnameseWelshWest IndianYakamaYaquiYugoslavianYumanYup'ikZimbabwean
Immigration
NonimmigrantsImmigrantsAfghanistanAfricaAlbaniaArgentinaArmeniaAsiaAustraliaAustriaBahamasBangladeshBarbadosBelarusBelgiumBelizeBoliviaBosnia and HerzegovinaBrazilBulgariaBurma/MyanmarCabo VerdeCambodiaCameroonCanadaCaribbeanCentral AmericaChileChinaColombiaCongoCosta RicaCroatiaCubaCzechoslovakiaDenmarkDominicaDominican RepublicEastern AfricaEastern AsiaEastern EuropeEcuadorEgyptEl SalvadorEnglandEritreaEthiopiaEuropeFijiFranceGermanyGhanaGreeceGrenadaGuatemalaGuyanaHaitiHondurasHong KongHungaryIndiaIndonesiaIranIraqIrelandIsraelItalyJamaicaJapanJordanKazakhstanKenyaKoreaKuwaitLaosLatin AmericaLatviaLebanonLiberiaLithuaniaMalaysiaMexicoMicronesiaMiddle AfricaMoldovaMoroccoNepalNetherlandsNicaraguaNigeriaNorth AmericaNorth MacedoniaNorthern AfricaNorthern EuropeNorwayOceaniaPakistanPanamaPeruPhilippinesPolandPortugalRomaniaRussiaSaudi ArabiaScotlandSenegalSerbiaSierra LeoneSingaporeSomaliaSouth AfricaSouth AmericaSouth Central AsiaSouth Eastern AsiaSouthern EuropeSpainSri LankaSt. Vincent and the GrenadinesSudanSwedenSwitzerlandSyriaTaiwanThailandTrinidad and TobagoTurkeyUgandaUkraineUruguayUzbekistanVenezuelaVietnamWest IndiesWestern AfricaWestern AsiaWestern EuropeYemenZaireZimbabweAzores
Seniors Poverty Over the Age of 75
Income
Poverty
Unemployment
Labor Participation
Family Structure
Vehicle Availability
Education Level
Disability

Seniors Poverty Over the Age of 75 Comparison

French American Indians

Nonimmigrants

Tragic
Average
12.9%
SENIORS POVERTY OVER THE AGE OF 75
6.1/ 100
METRIC RATING
213th/ 347
METRIC RANK
12.2%
SENIORS POVERTY OVER THE AGE OF 75
46.8/ 100
METRIC RATING
178th/ 347
METRIC RANK

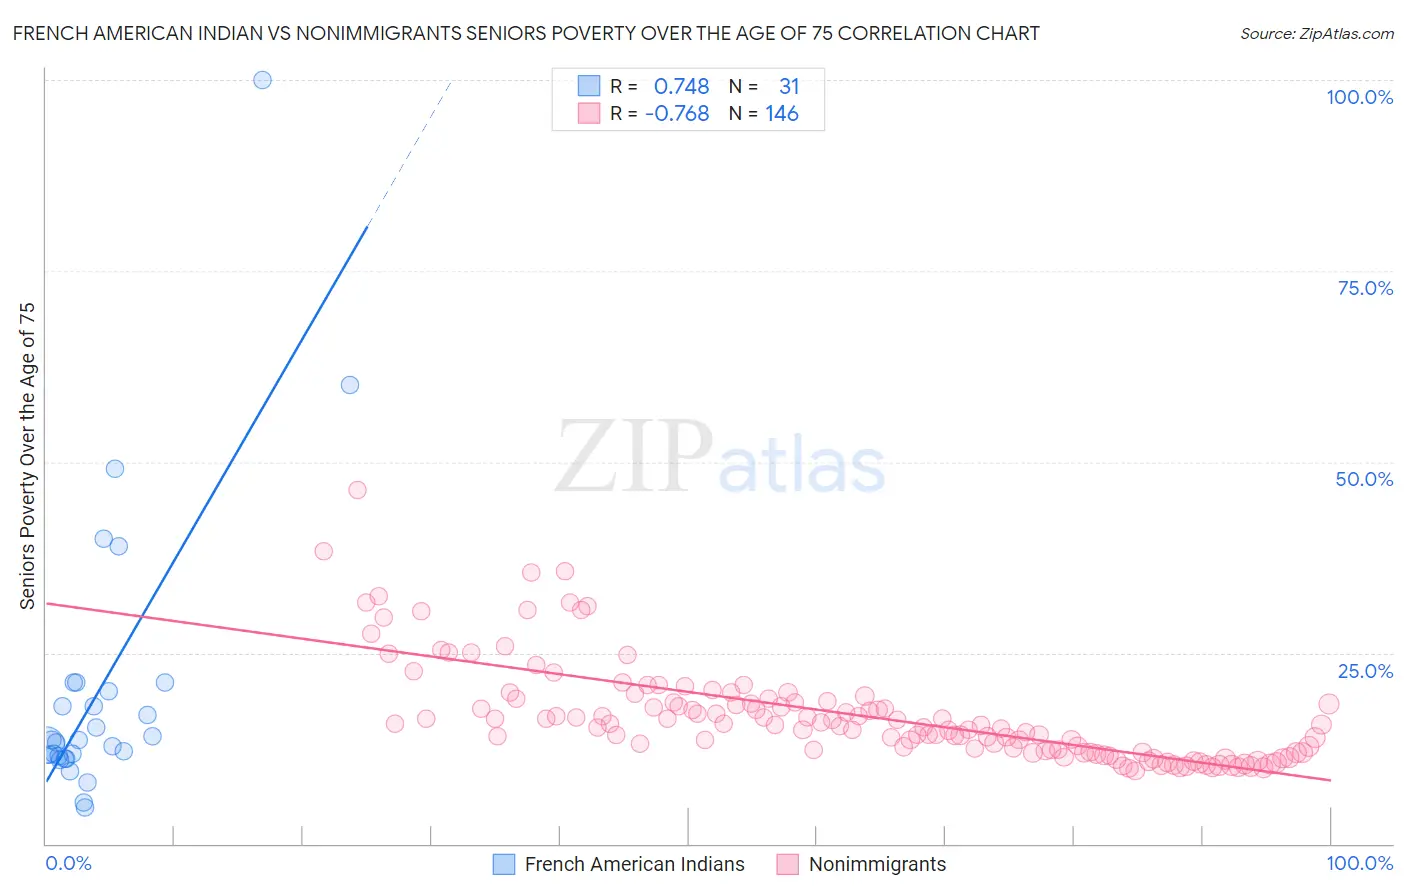
French American Indian vs Nonimmigrants Seniors Poverty Over the Age of 75 Correlation Chart

The statistical analysis conducted on geographies consisting of 131,506,514 people shows a strong positive correlation between the proportion of French American Indians and poverty level among seniors over the age of 75 in the United States with a correlation coefficient (R) of 0.748 and weighted average of 12.9%. Similarly, the statistical analysis conducted on geographies consisting of 564,663,130 people shows a strong negative correlation between the proportion of Nonimmigrants and poverty level among seniors over the age of 75 in the United States with a correlation coefficient (R) of -0.768 and weighted average of 12.2%, a difference of 5.3%.
French American Indian vs Nonimmigrants Seniors Poverty Over the Age of 75

Seniors Poverty Over the Age of 75 Correlation Summary

MeasurementFrench American IndianNonimmigrants
Minimum4.8%9.5%
Maximum100.0%46.3%
Range95.2%36.8%
Mean20.6%16.8%
Median13.5%15.5%
Interquartile 25% (IQ1)11.5%12.0%
Interquartile 75% (IQ3)21.1%18.5%
Interquartile Range (IQR)9.5%6.5%
Standard Deviation (Sample)19.3%6.5%
Standard Deviation (Population)19.0%6.5%

Similar Demographics by Seniors Poverty Over the Age of 75

Demographics Similar to French American Indians by Seniors Poverty Over the Age of 75

In terms of seniors poverty over the age of 75, the demographic groups most similar to French American Indians are Immigrants from Africa (12.9%, a difference of 0.070%), Immigrants from Hong Kong (12.8%, a difference of 0.15%), South American Indian (12.9%, a difference of 0.21%), Brazilian (12.8%, a difference of 0.28%), and Comanche (12.8%, a difference of 0.30%).
DemographicsRating | RankSeniors Poverty Over the Age of 75
Albanians
9.6
/100
|
#206
Tragic
12.7%
Costa Ricans
8.7
/100
|
#207
Tragic
12.8%
Immigrants | Eastern Asia
8.4
/100
|
#208
Tragic
12.8%
Immigrants | Liberia
7.3
/100
|
#209
Tragic
12.8%
Comanche
7.0
/100
|
#210
Tragic
12.8%
Brazilians
6.9
/100
|
#211
Tragic
12.8%
Immigrants | Hong Kong
6.5
/100
|
#212
Tragic
12.8%
French American Indians
6.1
/100
|
#213
Tragic
12.9%
Immigrants | Africa
5.9
/100
|
#214
Tragic
12.9%
South American Indians
5.5
/100
|
#215
Tragic
12.9%
Immigrants | Brazil
5.2
/100
|
#216
Tragic
12.9%
Bermudans
4.9
/100
|
#217
Tragic
12.9%
Immigrants | Western Asia
4.9
/100
|
#218
Tragic
12.9%
Ute
4.7
/100
|
#219
Tragic
12.9%
Seminole
4.5
/100
|
#220
Tragic
12.9%

Demographics Similar to Nonimmigrants by Seniors Poverty Over the Age of 75

In terms of seniors poverty over the age of 75, the demographic groups most similar to Nonimmigrants are Immigrants from Asia (12.2%, a difference of 0.080%), Immigrants from Iran (12.2%, a difference of 0.10%), Mongolian (12.2%, a difference of 0.11%), Immigrants from Saudi Arabia (12.2%, a difference of 0.21%), and Immigrants from South Eastern Asia (12.2%, a difference of 0.21%).
DemographicsRating | RankSeniors Poverty Over the Age of 75
Spaniards
51.6
/100
|
#171
Average
12.2%
Immigrants | Fiji
51.5
/100
|
#172
Average
12.2%
Arabs
50.5
/100
|
#173
Average
12.2%
Immigrants | Europe
50.0
/100
|
#174
Average
12.2%
Immigrants | Saudi Arabia
49.5
/100
|
#175
Average
12.2%
Immigrants | Iran
48.1
/100
|
#176
Average
12.2%
Immigrants | Asia
47.8
/100
|
#177
Average
12.2%
Immigrants | Nonimmigrants
46.8
/100
|
#178
Average
12.2%
Mongolians
45.5
/100
|
#179
Average
12.2%
Immigrants | South Eastern Asia
44.3
/100
|
#180
Average
12.2%
Immigrants | Australia
44.2
/100
|
#181
Average
12.2%
German Russians
41.4
/100
|
#182
Average
12.3%
Laotians
38.2
/100
|
#183
Fair
12.3%
Kiowa
36.0
/100
|
#184
Fair
12.3%
Immigrants | Malaysia
35.8
/100
|
#185
Fair
12.3%