French American Indian vs Immigrants from Korea Single Female Poverty
COMPARE
French American Indian
Immigrants from Korea
Single Female Poverty
Single Female Poverty Comparison
French American Indians
Immigrants from Korea
24.6%
SINGLE FEMALE POVERTY
0.0/ 100
METRIC RATING
294th/ 347
METRIC RANK
18.1%
SINGLE FEMALE POVERTY
100.0/ 100
METRIC RATING
17th/ 347
METRIC RANK
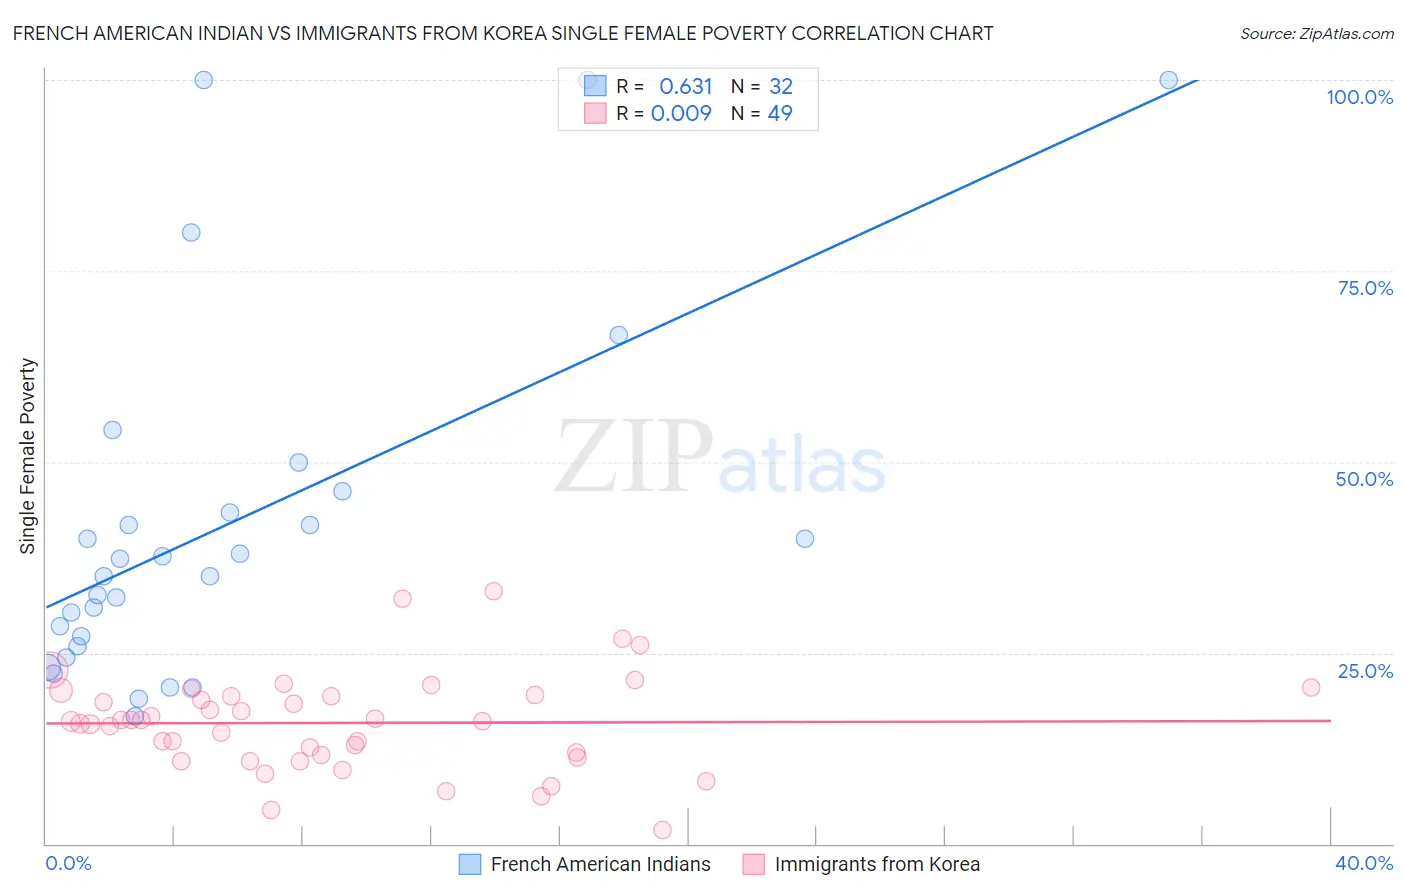
French American Indian vs Immigrants from Korea Single Female Poverty Correlation Chart
The statistical analysis conducted on geographies consisting of 131,011,978 people shows a significant positive correlation between the proportion of French American Indians and poverty level among single females in the United States with a correlation coefficient (R) of 0.631 and weighted average of 24.6%. Similarly, the statistical analysis conducted on geographies consisting of 408,307,529 people shows no correlation between the proportion of Immigrants from Korea and poverty level among single females in the United States with a correlation coefficient (R) of 0.009 and weighted average of 18.1%, a difference of 35.7%.
Single Female Poverty Correlation Summary
| Measurement | French American Indian | Immigrants from Korea |
| Minimum | 16.7% | 1.8% |
| Maximum | 100.0% | 33.0% |
| Range | 83.3% | 31.2% |
| Mean | 41.9% | 15.8% |
| Median | 36.2% | 16.1% |
| Interquartile 25% (IQ1) | 26.5% | 11.4% |
| Interquartile 75% (IQ3) | 44.8% | 19.4% |
| Interquartile Range (IQR) | 18.3% | 8.0% |
| Standard Deviation (Sample) | 23.3% | 6.3% |
| Standard Deviation (Population) | 22.9% | 6.3% |
Similar Demographics by Single Female Poverty
Demographics Similar to French American Indians by Single Female Poverty
In terms of single female poverty, the demographic groups most similar to French American Indians are American (24.5%, a difference of 0.15%), Alsatian (24.5%, a difference of 0.23%), Hispanic or Latino (24.6%, a difference of 0.35%), Osage (24.4%, a difference of 0.59%), and African (24.8%, a difference of 0.83%).
| Demographics | Rating | Rank | Single Female Poverty |
| Bangladeshis | 0.0 /100 | #287 | Tragic 24.2% |
| Spanish Americans | 0.0 /100 | #288 | Tragic 24.2% |
| U.S. Virgin Islanders | 0.0 /100 | #289 | Tragic 24.2% |
| Indonesians | 0.0 /100 | #290 | Tragic 24.3% |
| Osage | 0.0 /100 | #291 | Tragic 24.4% |
| Alsatians | 0.0 /100 | #292 | Tragic 24.5% |
| Americans | 0.0 /100 | #293 | Tragic 24.5% |
| French American Indians | 0.0 /100 | #294 | Tragic 24.6% |
| Hispanics or Latinos | 0.0 /100 | #295 | Tragic 24.6% |
| Africans | 0.0 /100 | #296 | Tragic 24.8% |
| Immigrants | Central America | 0.0 /100 | #297 | Tragic 24.8% |
| Yaqui | 0.0 /100 | #298 | Tragic 24.9% |
| Mexicans | 0.0 /100 | #299 | Tragic 25.0% |
| Blackfeet | 0.0 /100 | #300 | Tragic 25.1% |
| Hondurans | 0.0 /100 | #301 | Tragic 25.1% |
Demographics Similar to Immigrants from Korea by Single Female Poverty
In terms of single female poverty, the demographic groups most similar to Immigrants from Korea are Immigrants from Eastern Asia (18.1%, a difference of 0.28%), Immigrants from China (18.1%, a difference of 0.32%), Iranian (18.0%, a difference of 0.60%), Indian (Asian) (17.9%, a difference of 0.76%), and Bolivian (17.9%, a difference of 0.90%).
| Demographics | Rating | Rank | Single Female Poverty |
| Immigrants | Ireland | 100.0 /100 | #10 | Exceptional 17.8% |
| Immigrants | Lithuania | 100.0 /100 | #11 | Exceptional 17.8% |
| Immigrants | South Central Asia | 100.0 /100 | #12 | Exceptional 17.8% |
| Immigrants | Bolivia | 100.0 /100 | #13 | Exceptional 17.8% |
| Bolivians | 100.0 /100 | #14 | Exceptional 17.9% |
| Indians (Asian) | 100.0 /100 | #15 | Exceptional 17.9% |
| Iranians | 100.0 /100 | #16 | Exceptional 18.0% |
| Immigrants | Korea | 100.0 /100 | #17 | Exceptional 18.1% |
| Immigrants | Eastern Asia | 100.0 /100 | #18 | Exceptional 18.1% |
| Immigrants | China | 100.0 /100 | #19 | Exceptional 18.1% |
| Immigrants | Greece | 100.0 /100 | #20 | Exceptional 18.3% |
| Maltese | 100.0 /100 | #21 | Exceptional 18.3% |
| Burmese | 100.0 /100 | #22 | Exceptional 18.3% |
| Asians | 100.0 /100 | #23 | Exceptional 18.3% |
| Armenians | 100.0 /100 | #24 | Exceptional 18.3% |