French American Indian vs Immigrants from Australia Seniors Poverty Over the Age of 65
COMPARE
French American Indian
Immigrants from Australia
Seniors Poverty Over the Age of 65
Seniors Poverty Over the Age of 65 Comparison
French American Indians
Immigrants from Australia
11.5%
SENIORS POVERTY OVER THE AGE OF 65
8.7/ 100
METRIC RATING
215th/ 347
METRIC RANK
10.5%
SENIORS POVERTY OVER THE AGE OF 65
85.1/ 100
METRIC RATING
137th/ 347
METRIC RANK
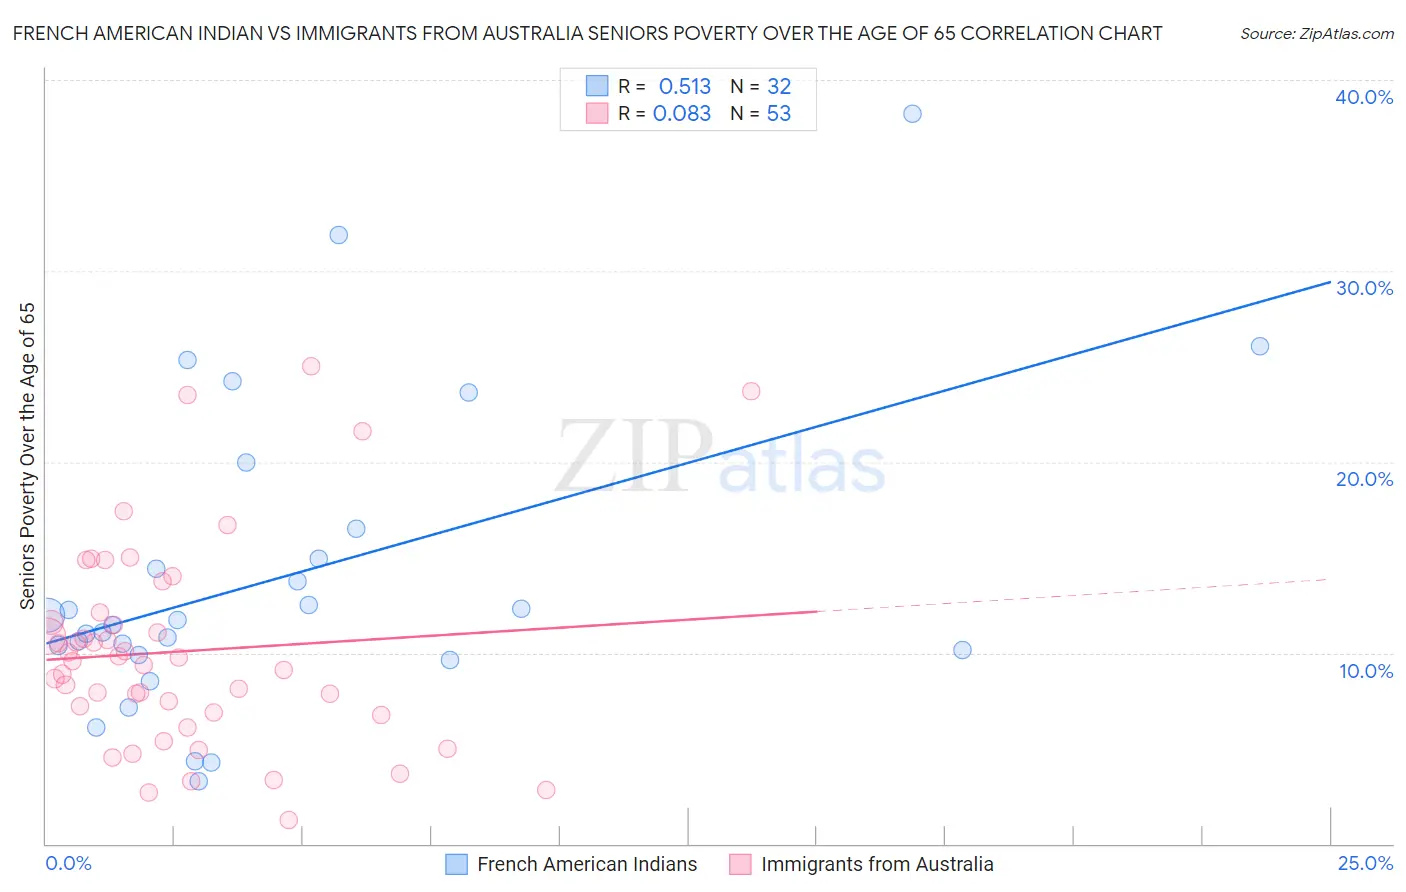
French American Indian vs Immigrants from Australia Seniors Poverty Over the Age of 65 Correlation Chart
The statistical analysis conducted on geographies consisting of 131,882,711 people shows a substantial positive correlation between the proportion of French American Indians and poverty level among seniors over the age of 65 in the United States with a correlation coefficient (R) of 0.513 and weighted average of 11.5%. Similarly, the statistical analysis conducted on geographies consisting of 226,798,964 people shows a slight positive correlation between the proportion of Immigrants from Australia and poverty level among seniors over the age of 65 in the United States with a correlation coefficient (R) of 0.083 and weighted average of 10.5%, a difference of 9.5%.
Seniors Poverty Over the Age of 65 Correlation Summary
| Measurement | French American Indian | Immigrants from Australia |
| Minimum | 3.3% | 1.2% |
| Maximum | 38.2% | 25.0% |
| Range | 35.0% | 23.8% |
| Mean | 14.0% | 10.1% |
| Median | 11.6% | 9.5% |
| Interquartile 25% (IQ1) | 10.0% | 6.8% |
| Interquartile 75% (IQ3) | 15.7% | 11.9% |
| Interquartile Range (IQR) | 5.7% | 5.0% |
| Standard Deviation (Sample) | 8.0% | 5.4% |
| Standard Deviation (Population) | 7.9% | 5.3% |
Similar Demographics by Seniors Poverty Over the Age of 65
Demographics Similar to French American Indians by Seniors Poverty Over the Age of 65
In terms of seniors poverty over the age of 65, the demographic groups most similar to French American Indians are Immigrants from Russia (11.5%, a difference of 0.040%), Nepalese (11.5%, a difference of 0.060%), Immigrants from China (11.5%, a difference of 0.22%), Indonesian (11.5%, a difference of 0.42%), and Immigrants from Morocco (11.6%, a difference of 0.55%).
| Demographics | Rating | Rank | Seniors Poverty Over the Age of 65 |
| South American Indians | 11.7 /100 | #208 | Poor 11.4% |
| Paraguayans | 11.3 /100 | #209 | Poor 11.4% |
| Ugandans | 11.2 /100 | #210 | Poor 11.4% |
| Indonesians | 10.4 /100 | #211 | Poor 11.5% |
| Immigrants | China | 9.5 /100 | #212 | Tragic 11.5% |
| Nepalese | 8.9 /100 | #213 | Tragic 11.5% |
| Immigrants | Russia | 8.8 /100 | #214 | Tragic 11.5% |
| French American Indians | 8.7 /100 | #215 | Tragic 11.5% |
| Immigrants | Morocco | 6.8 /100 | #216 | Tragic 11.6% |
| Immigrants | Africa | 6.4 /100 | #217 | Tragic 11.6% |
| Immigrants | Ukraine | 5.7 /100 | #218 | Tragic 11.6% |
| Arapaho | 5.2 /100 | #219 | Tragic 11.6% |
| Peruvians | 4.2 /100 | #220 | Tragic 11.7% |
| Argentineans | 4.1 /100 | #221 | Tragic 11.7% |
| Immigrants | Chile | 3.9 /100 | #222 | Tragic 11.7% |
Demographics Similar to Immigrants from Australia by Seniors Poverty Over the Age of 65
In terms of seniors poverty over the age of 65, the demographic groups most similar to Immigrants from Australia are Immigrants from Latvia (10.5%, a difference of 0.060%), Portuguese (10.5%, a difference of 0.16%), Immigrants from Serbia (10.5%, a difference of 0.26%), Immigrants from Norway (10.5%, a difference of 0.27%), and Immigrants from Kenya (10.5%, a difference of 0.29%).
| Demographics | Rating | Rank | Seniors Poverty Over the Age of 65 |
| Immigrants | Oceania | 88.4 /100 | #130 | Excellent 10.4% |
| Egyptians | 87.8 /100 | #131 | Excellent 10.5% |
| Immigrants | Turkey | 87.7 /100 | #132 | Excellent 10.5% |
| Guamanians/Chamorros | 87.5 /100 | #133 | Excellent 10.5% |
| Sierra Leoneans | 86.8 /100 | #134 | Excellent 10.5% |
| Immigrants | Norway | 86.5 /100 | #135 | Excellent 10.5% |
| Immigrants | Serbia | 86.4 /100 | #136 | Excellent 10.5% |
| Immigrants | Australia | 85.1 /100 | #137 | Excellent 10.5% |
| Immigrants | Latvia | 84.7 /100 | #138 | Excellent 10.5% |
| Portuguese | 84.1 /100 | #139 | Excellent 10.5% |
| Immigrants | Kenya | 83.4 /100 | #140 | Excellent 10.5% |
| Immigrants | Europe | 83.3 /100 | #141 | Excellent 10.5% |
| Osage | 82.8 /100 | #142 | Excellent 10.6% |
| Immigrants | Asia | 80.8 /100 | #143 | Excellent 10.6% |
| Iraqis | 80.7 /100 | #144 | Excellent 10.6% |