Fijian vs Immigrants from Zaire Seniors Poverty Over the Age of 65
COMPARE
Fijian
Immigrants from Zaire
Seniors Poverty Over the Age of 65
Seniors Poverty Over the Age of 65 Comparison
Fijians
Immigrants from Zaire
10.7%
SENIORS POVERTY OVER THE AGE OF 65
75.6/ 100
METRIC RATING
153rd/ 347
METRIC RANK
11.3%
SENIORS POVERTY OVER THE AGE OF 65
16.9/ 100
METRIC RATING
203rd/ 347
METRIC RANK
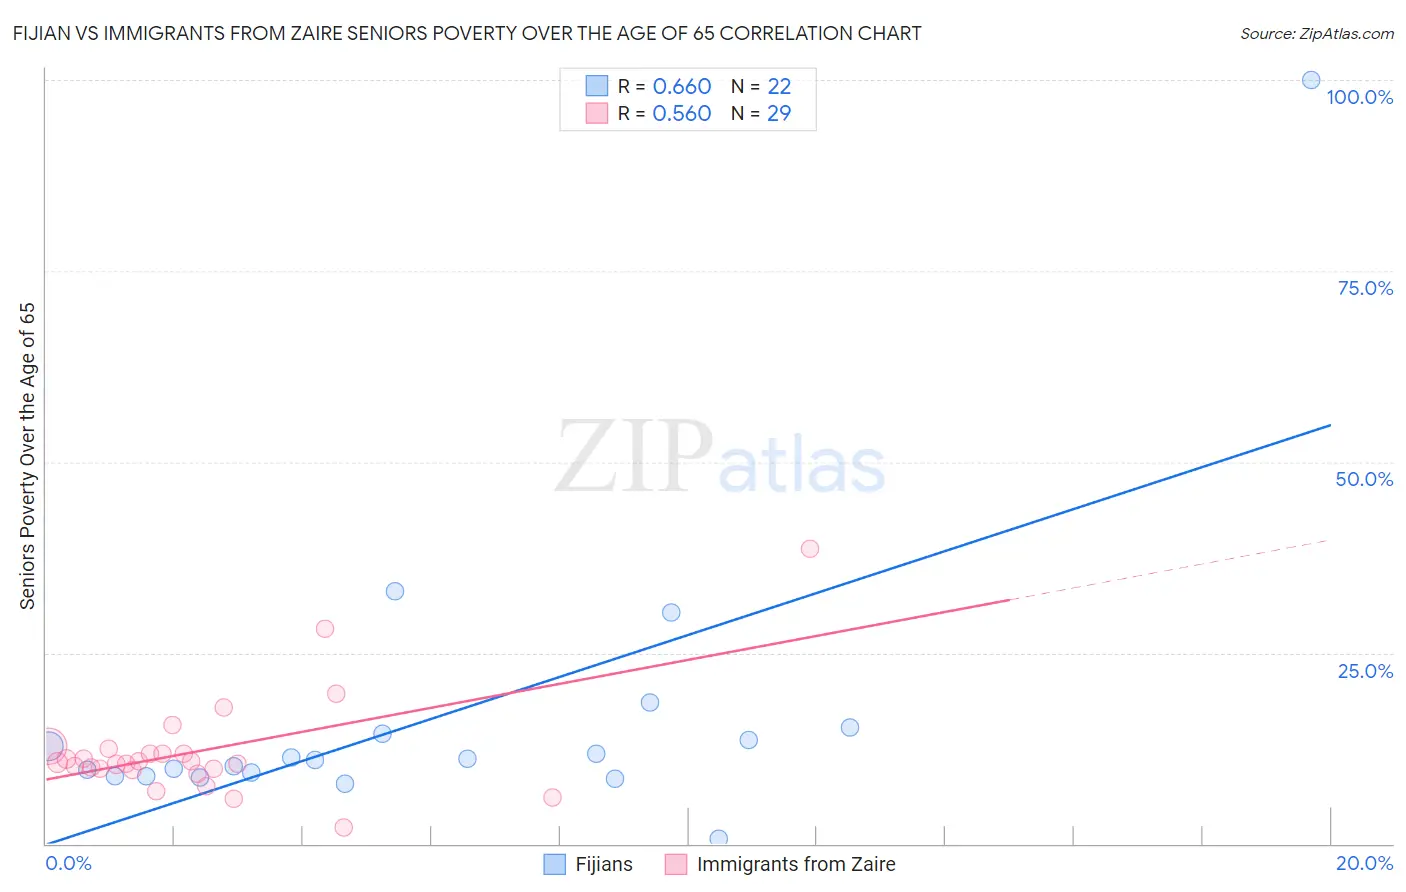
Fijian vs Immigrants from Zaire Seniors Poverty Over the Age of 65 Correlation Chart
The statistical analysis conducted on geographies consisting of 55,831,768 people shows a significant positive correlation between the proportion of Fijians and poverty level among seniors over the age of 65 in the United States with a correlation coefficient (R) of 0.660 and weighted average of 10.7%. Similarly, the statistical analysis conducted on geographies consisting of 107,186,275 people shows a substantial positive correlation between the proportion of Immigrants from Zaire and poverty level among seniors over the age of 65 in the United States with a correlation coefficient (R) of 0.560 and weighted average of 11.3%, a difference of 6.2%.
Seniors Poverty Over the Age of 65 Correlation Summary
| Measurement | Fijian | Immigrants from Zaire |
| Minimum | 0.60% | 2.2% |
| Maximum | 100.0% | 38.6% |
| Range | 99.4% | 36.5% |
| Mean | 16.6% | 12.2% |
| Median | 11.0% | 10.6% |
| Interquartile 25% (IQ1) | 8.9% | 9.7% |
| Interquartile 75% (IQ3) | 14.4% | 12.1% |
| Interquartile Range (IQR) | 5.5% | 2.4% |
| Standard Deviation (Sample) | 19.9% | 6.9% |
| Standard Deviation (Population) | 19.5% | 6.8% |
Similar Demographics by Seniors Poverty Over the Age of 65
Demographics Similar to Fijians by Seniors Poverty Over the Age of 65
In terms of seniors poverty over the age of 65, the demographic groups most similar to Fijians are Immigrants from Saudi Arabia (10.7%, a difference of 0.080%), Immigrants from Egypt (10.6%, a difference of 0.11%), Spanish (10.6%, a difference of 0.15%), Immigrants from Switzerland (10.6%, a difference of 0.22%), and Chickasaw (10.7%, a difference of 0.24%).
| Demographics | Rating | Rank | Seniors Poverty Over the Age of 65 |
| Alaskan Athabascans | 79.1 /100 | #146 | Good 10.6% |
| Immigrants | Greece | 79.0 /100 | #147 | Good 10.6% |
| Americans | 78.1 /100 | #148 | Good 10.6% |
| Immigrants | Cameroon | 78.1 /100 | #149 | Good 10.6% |
| Immigrants | Switzerland | 77.3 /100 | #150 | Good 10.6% |
| Spanish | 76.8 /100 | #151 | Good 10.6% |
| Immigrants | Egypt | 76.5 /100 | #152 | Good 10.6% |
| Fijians | 75.6 /100 | #153 | Good 10.7% |
| Immigrants | Saudi Arabia | 74.9 /100 | #154 | Good 10.7% |
| Chickasaw | 73.6 /100 | #155 | Good 10.7% |
| Ethiopians | 72.9 /100 | #156 | Good 10.7% |
| Immigrants | Ethiopia | 72.9 /100 | #157 | Good 10.7% |
| Immigrants | Sierra Leone | 71.7 /100 | #158 | Good 10.7% |
| Immigrants | Micronesia | 70.8 /100 | #159 | Good 10.7% |
| Sudanese | 68.2 /100 | #160 | Good 10.7% |
Demographics Similar to Immigrants from Zaire by Seniors Poverty Over the Age of 65
In terms of seniors poverty over the age of 65, the demographic groups most similar to Immigrants from Zaire are Costa Rican (11.3%, a difference of 0.010%), Israeli (11.3%, a difference of 0.070%), Immigrants from Brazil (11.3%, a difference of 0.13%), Brazilian (11.3%, a difference of 0.24%), and Choctaw (11.4%, a difference of 0.38%).
| Demographics | Rating | Rank | Seniors Poverty Over the Age of 65 |
| Bangladeshis | 25.2 /100 | #196 | Fair 11.2% |
| Albanians | 24.4 /100 | #197 | Fair 11.2% |
| Immigrants | Burma/Myanmar | 21.3 /100 | #198 | Fair 11.3% |
| Immigrants | Israel | 20.3 /100 | #199 | Fair 11.3% |
| Alsatians | 20.1 /100 | #200 | Fair 11.3% |
| Immigrants | Brazil | 17.8 /100 | #201 | Poor 11.3% |
| Costa Ricans | 17.0 /100 | #202 | Poor 11.3% |
| Immigrants | Zaire | 16.9 /100 | #203 | Poor 11.3% |
| Israelis | 16.5 /100 | #204 | Poor 11.3% |
| Brazilians | 15.4 /100 | #205 | Poor 11.3% |
| Choctaw | 14.5 /100 | #206 | Poor 11.4% |
| Immigrants | Western Asia | 13.6 /100 | #207 | Poor 11.4% |
| South American Indians | 11.7 /100 | #208 | Poor 11.4% |
| Paraguayans | 11.3 /100 | #209 | Poor 11.4% |
| Ugandans | 11.2 /100 | #210 | Poor 11.4% |