European vs Immigrants from Netherlands Female Poverty Among 25-34 Year Olds

COMPARE

European
Race
Ancestry
AfghanAfricanAlaska NativeAlaskan AthabascanAlbanianAleutAlsatianAmericanApacheArabArapahoArgentineanArmenianAssyrian/Chaldean/SyriacAustralianAustrianBahamianBangladeshiBarbadianBasqueBelgianBelizeanBermudanBhutaneseBlackfeetBolivianBrazilianBritishBritish West IndianBulgarianBurmeseCajunCambodianCanadianCape VerdeanCarpatho RusynCelticCentral AmericanCentral American IndianCherokeeCheyenneChickasawChileanChineseChippewaChoctawColombianColvilleComancheCosta RicanCreeCreekCroatianCrowCubanCypriotCzechCzechoslovakianDanishDelawareDominicanDutchDutch West IndianEastern EuropeanEcuadorianEgyptianEnglishEstonianEthiopianEuropeanFijianFilipinoFinnishFrenchFrench American IndianFrench CanadianGermanGerman RussianGhanaianGreekGuamanian/ChamorroGuatemalanGuyaneseHaitianHmongHonduranHopiHoumaHungarianIcelanderIndian (Asian)IndonesianInupiatIranianIraqiIrishIroquoisIsraeliItalianJamaicanJapaneseJordanianKenyanKiowaKoreanLaotianLatvianLebaneseLiberianLithuanianLumbeeLuxembourgerMacedonianMalaysianMalteseMarshalleseMenomineeMexicanMexican American IndianMongolianMoroccanNative HawaiianNavajoNepaleseNew ZealanderNicaraguanNigerianNorthern EuropeanNorwegianOkinawanOsageOttawaPaiutePakistaniPalestinianPanamanianParaguayanPennsylvania GermanPeruvianPimaPolishPortuguesePotawatomiPuebloPuerto RicanPuget Sound SalishRomanianRussianSalvadoranSamoanScandinavianScotch-IrishScottishSeminoleSenegaleseSerbianShoshoneSierra LeoneanSiouxSlavicSlovakSloveneSomaliSouth AfricanSouth AmericanSouth American IndianSoviet UnionSpaniardSpanishSpanish AmericanSpanish American IndianSri LankanSubsaharan AfricanSudaneseSwedishSwissSyrianTaiwaneseThaiTlingit-HaidaTohono O'OdhamTonganTrinidadian and TobagonianTsimshianTurkishU.S. Virgin IslanderUgandanUkrainianUruguayanUteVenezuelanVietnameseWelshWest IndianYakamaYaquiYugoslavianYumanYup'ikZimbabwean
Immigration
NonimmigrantsImmigrantsAfghanistanAfricaAlbaniaArgentinaArmeniaAsiaAustraliaAustriaBahamasBangladeshBarbadosBelarusBelgiumBelizeBoliviaBosnia and HerzegovinaBrazilBulgariaBurma/MyanmarCabo VerdeCambodiaCameroonCanadaCaribbeanCentral AmericaChileChinaColombiaCongoCosta RicaCroatiaCubaCzechoslovakiaDenmarkDominicaDominican RepublicEastern AfricaEastern AsiaEastern EuropeEcuadorEgyptEl SalvadorEnglandEritreaEthiopiaEuropeFijiFranceGermanyGhanaGreeceGrenadaGuatemalaGuyanaHaitiHondurasHong KongHungaryIndiaIndonesiaIranIraqIrelandIsraelItalyJamaicaJapanJordanKazakhstanKenyaKoreaKuwaitLaosLatin AmericaLatviaLebanonLiberiaLithuaniaMalaysiaMexicoMicronesiaMiddle AfricaMoldovaMoroccoNepalNicaraguaNigeriaNorth AmericaNorth MacedoniaNorthern AfricaNorthern EuropeNorwayOceaniaPakistanPanamaPeruPhilippinesPolandPortugalRomaniaRussiaSaudi ArabiaScotlandSenegalSerbiaSierra LeoneSingaporeSomaliaSouth AfricaSouth AmericaSouth Central AsiaSouth Eastern AsiaSouthern EuropeSpainSri LankaSt. Vincent and the GrenadinesSudanSwedenSwitzerlandSyriaTaiwanThailandTrinidad and TobagoTurkeyUgandaUkraineUruguayUzbekistanVenezuelaVietnamWest IndiesWestern AfricaWestern AsiaWestern EuropeYemenZaireZimbabweAzores
Immigrants from Netherlands
Race
Ancestry
AfghanAfricanAlaska NativeAlaskan AthabascanAlbanianAleutAlsatianAmericanApacheArabArapahoArgentineanArmenianAssyrian/Chaldean/SyriacAustralianAustrianBahamianBangladeshiBarbadianBasqueBelgianBelizeanBermudanBhutaneseBlackfeetBolivianBrazilianBritishBritish West IndianBulgarianBurmeseCajunCambodianCanadianCape VerdeanCarpatho RusynCelticCentral AmericanCentral American IndianCherokeeCheyenneChickasawChileanChineseChippewaChoctawColombianColvilleComancheCosta RicanCreeCreekCroatianCrowCubanCypriotCzechCzechoslovakianDanishDelawareDominicanDutchDutch West IndianEastern EuropeanEcuadorianEgyptianEnglishEstonianEthiopianFijianFilipinoFinnishFrenchFrench American IndianFrench CanadianGermanGerman RussianGhanaianGreekGuamanian/ChamorroGuatemalanGuyaneseHaitianHmongHonduranHopiHoumaHungarianIcelanderIndian (Asian)IndonesianInupiatIranianIraqiIrishIroquoisIsraeliItalianJamaicanJapaneseJordanianKenyanKiowaKoreanLaotianLatvianLebaneseLiberianLithuanianLumbeeLuxembourgerMacedonianMalaysianMalteseMarshalleseMenomineeMexicanMexican American IndianMongolianMoroccanNative HawaiianNavajoNepaleseNew ZealanderNicaraguanNigerianNorthern EuropeanNorwegianOkinawanOsageOttawaPaiutePakistaniPalestinianPanamanianParaguayanPennsylvania GermanPeruvianPimaPolishPortuguesePotawatomiPuebloPuerto RicanPuget Sound SalishRomanianRussianSalvadoranSamoanScandinavianScotch-IrishScottishSeminoleSenegaleseSerbianShoshoneSierra LeoneanSiouxSlavicSlovakSloveneSomaliSouth AfricanSouth AmericanSouth American IndianSoviet UnionSpaniardSpanishSpanish AmericanSpanish American IndianSri LankanSubsaharan AfricanSudaneseSwedishSwissSyrianTaiwaneseThaiTlingit-HaidaTohono O'OdhamTonganTrinidadian and TobagonianTsimshianTurkishU.S. Virgin IslanderUgandanUkrainianUruguayanUteVenezuelanVietnameseWelshWest IndianYakamaYaquiYugoslavianYumanYup'ikZimbabwean
Immigration
NonimmigrantsImmigrantsAfghanistanAfricaAlbaniaArgentinaArmeniaAsiaAustraliaAustriaBahamasBangladeshBarbadosBelarusBelgiumBelizeBoliviaBosnia and HerzegovinaBrazilBulgariaBurma/MyanmarCabo VerdeCambodiaCameroonCanadaCaribbeanCentral AmericaChileChinaColombiaCongoCosta RicaCroatiaCubaCzechoslovakiaDenmarkDominicaDominican RepublicEastern AfricaEastern AsiaEastern EuropeEcuadorEgyptEl SalvadorEnglandEritreaEthiopiaEuropeFijiFranceGermanyGhanaGreeceGrenadaGuatemalaGuyanaHaitiHondurasHong KongHungaryIndiaIndonesiaIranIraqIrelandIsraelItalyJamaicaJapanJordanKazakhstanKenyaKoreaKuwaitLaosLatin AmericaLatviaLebanonLiberiaLithuaniaMalaysiaMexicoMicronesiaMiddle AfricaMoldovaMoroccoNepalNetherlandsNicaraguaNigeriaNorth AmericaNorth MacedoniaNorthern AfricaNorthern EuropeNorwayOceaniaPakistanPanamaPeruPhilippinesPolandPortugalRomaniaRussiaSaudi ArabiaScotlandSenegalSerbiaSierra LeoneSingaporeSomaliaSouth AfricaSouth AmericaSouth Central AsiaSouth Eastern AsiaSouthern EuropeSpainSri LankaSt. Vincent and the GrenadinesSudanSwedenSwitzerlandSyriaTaiwanThailandTrinidad and TobagoTurkeyUgandaUkraineUruguayUzbekistanVenezuelaVietnamWest IndiesWestern AfricaWestern AsiaWestern EuropeYemenZaireZimbabweAzores
Female Poverty Among 25-34 Year Olds
Income
Poverty
Unemployment
Labor Participation
Family Structure
Vehicle Availability
Education Level
Disability

Female Poverty Among 25-34 Year Olds Comparison

Europeans

Immigrants from Netherlands

Good
Exceptional
13.2%
FEMALE POVERTY AMONG 25-34 YEAR OLDS
76.8/ 100
METRIC RATING
147th/ 347
METRIC RANK
12.8%
FEMALE POVERTY AMONG 25-34 YEAR OLDS
92.0/ 100
METRIC RATING
124th/ 347
METRIC RANK

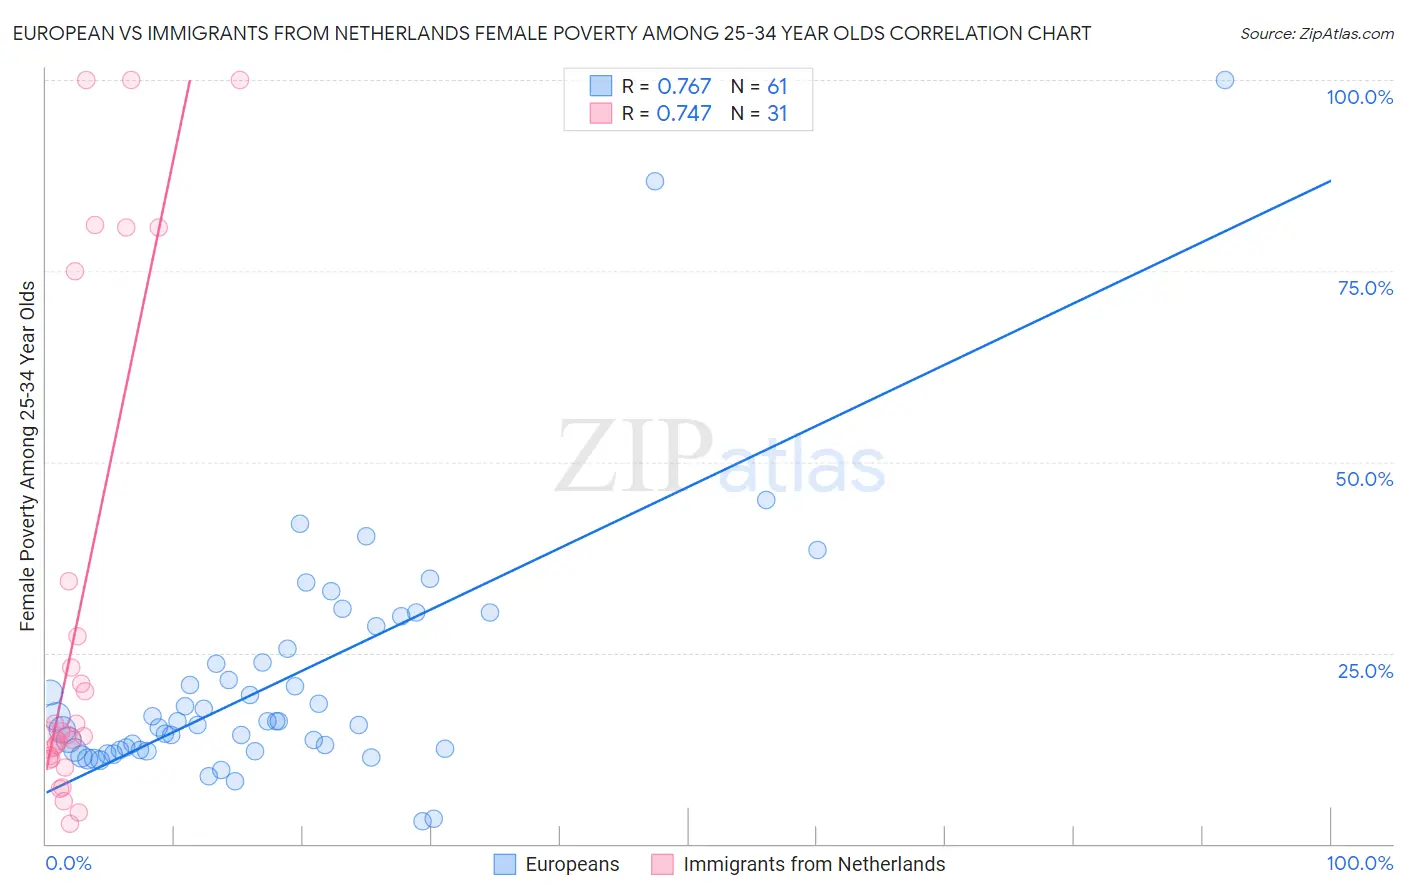
European vs Immigrants from Netherlands Female Poverty Among 25-34 Year Olds Correlation Chart

The statistical analysis conducted on geographies consisting of 541,422,782 people shows a strong positive correlation between the proportion of Europeans and poverty level among females between the ages 25 and 34 in the United States with a correlation coefficient (R) of 0.767 and weighted average of 13.2%. Similarly, the statistical analysis conducted on geographies consisting of 234,780,200 people shows a strong positive correlation between the proportion of Immigrants from Netherlands and poverty level among females between the ages 25 and 34 in the United States with a correlation coefficient (R) of 0.747 and weighted average of 12.8%, a difference of 2.7%.
European vs Immigrants from Netherlands Female Poverty Among 25-34 Year Olds

Female Poverty Among 25-34 Year Olds Correlation Summary

MeasurementEuropeanImmigrants from Netherlands
Minimum2.9%2.7%
Maximum100.0%100.0%
Range97.1%97.3%
Mean21.1%30.8%
Median16.0%14.2%
Interquartile 25% (IQ1)12.3%11.1%
Interquartile 75% (IQ3)24.6%34.4%
Interquartile Range (IQR)12.3%23.3%
Standard Deviation (Sample)16.4%32.5%
Standard Deviation (Population)16.3%32.0%

Similar Demographics by Female Poverty Among 25-34 Year Olds

Demographics Similar to Europeans by Female Poverty Among 25-34 Year Olds

In terms of female poverty among 25-34 year olds, the demographic groups most similar to Europeans are Lebanese (13.2%, a difference of 0.0%), South American (13.2%, a difference of 0.010%), Colombian (13.2%, a difference of 0.050%), Sierra Leonean (13.2%, a difference of 0.070%), and Iraqi (13.2%, a difference of 0.090%).
DemographicsRating | RankFemale Poverty Among 25-34 Year Olds
Immigrants | Iraq
83.6
/100
|
#140
Excellent
13.1%
New Zealanders
83.4
/100
|
#141
Excellent
13.1%
Scandinavians
82.3
/100
|
#142
Excellent
13.1%
Israelis
81.9
/100
|
#143
Excellent
13.1%
Native Hawaiians
78.9
/100
|
#144
Good
13.2%
Colombians
77.2
/100
|
#145
Good
13.2%
South Americans
76.9
/100
|
#146
Good
13.2%
Europeans
76.8
/100
|
#147
Good
13.2%
Lebanese
76.8
/100
|
#148
Good
13.2%
Sierra Leoneans
76.3
/100
|
#149
Good
13.2%
Iraqis
76.0
/100
|
#150
Good
13.2%
Costa Ricans
75.8
/100
|
#151
Good
13.2%
Slavs
75.7
/100
|
#152
Good
13.2%
Northern Europeans
73.7
/100
|
#153
Good
13.2%
Arabs
73.5
/100
|
#154
Good
13.2%

Demographics Similar to Immigrants from Netherlands by Female Poverty Among 25-34 Year Olds

In terms of female poverty among 25-34 year olds, the demographic groups most similar to Immigrants from Netherlands are Immigrants from Canada (12.9%, a difference of 0.15%), Slovene (12.8%, a difference of 0.22%), Immigrants from Fiji (12.9%, a difference of 0.23%), Immigrants from Western Asia (12.8%, a difference of 0.24%), and Romanian (12.8%, a difference of 0.26%).
DemographicsRating | RankFemale Poverty Among 25-34 Year Olds
Immigrants | Kuwait
93.1
/100
|
#117
Exceptional
12.8%
Mongolians
93.0
/100
|
#118
Exceptional
12.8%
Immigrants | Nepal
93.0
/100
|
#119
Exceptional
12.8%
Carpatho Rusyns
93.0
/100
|
#120
Exceptional
12.8%
Romanians
92.8
/100
|
#121
Exceptional
12.8%
Immigrants | Western Asia
92.7
/100
|
#122
Exceptional
12.8%
Slovenes
92.7
/100
|
#123
Exceptional
12.8%
Immigrants | Netherlands
92.0
/100
|
#124
Exceptional
12.8%
Immigrants | Canada
91.5
/100
|
#125
Exceptional
12.9%
Immigrants | Fiji
91.2
/100
|
#126
Exceptional
12.9%
Czechs
90.3
/100
|
#127
Exceptional
12.9%
Syrians
90.2
/100
|
#128
Exceptional
12.9%
Immigrants | North America
89.7
/100
|
#129
Excellent
12.9%
Immigrants | Uzbekistan
89.6
/100
|
#130
Excellent
12.9%
Pakistanis
88.4
/100
|
#131
Excellent
13.0%