Ethiopian vs Iranian Seniors Poverty Over the Age of 75

COMPARE

Ethiopian
Race
Ancestry
AfghanAfricanAlaska NativeAlaskan AthabascanAlbanianAleutAlsatianAmericanApacheArabArapahoArgentineanArmenianAssyrian/Chaldean/SyriacAustralianAustrianBahamianBangladeshiBarbadianBasqueBelgianBelizeanBermudanBhutaneseBlackfeetBolivianBrazilianBritishBritish West IndianBulgarianBurmeseCajunCambodianCanadianCape VerdeanCarpatho RusynCelticCentral AmericanCentral American IndianCherokeeCheyenneChickasawChileanChineseChippewaChoctawColombianColvilleComancheCosta RicanCreeCreekCroatianCrowCubanCypriotCzechCzechoslovakianDanishDelawareDominicanDutchDutch West IndianEastern EuropeanEcuadorianEgyptianEnglishEstonianEthiopianEuropeanFijianFilipinoFinnishFrenchFrench American IndianFrench CanadianGermanGerman RussianGhanaianGreekGuamanian/ChamorroGuatemalanGuyaneseHaitianHmongHonduranHopiHoumaHungarianIcelanderIndian (Asian)IndonesianInupiatIraqiIrishIroquoisIsraeliItalianJamaicanJapaneseJordanianKenyanKiowaKoreanLaotianLatvianLebaneseLiberianLithuanianLumbeeLuxembourgerMacedonianMalaysianMalteseMarshalleseMenomineeMexicanMexican American IndianMongolianMoroccanNative HawaiianNavajoNepaleseNew ZealanderNicaraguanNigerianNorthern EuropeanNorwegianOkinawanOsageOttawaPaiutePakistaniPalestinianPanamanianParaguayanPennsylvania GermanPeruvianPimaPolishPortuguesePotawatomiPuebloPuerto RicanPuget Sound SalishRomanianRussianSalvadoranSamoanScandinavianScotch-IrishScottishSeminoleSenegaleseSerbianShoshoneSierra LeoneanSiouxSlavicSlovakSloveneSomaliSouth AfricanSouth AmericanSouth American IndianSoviet UnionSpaniardSpanishSpanish AmericanSpanish American IndianSri LankanSubsaharan AfricanSudaneseSwedishSwissSyrianTaiwaneseThaiTlingit-HaidaTohono O'OdhamTonganTrinidadian and TobagonianTsimshianTurkishU.S. Virgin IslanderUgandanUkrainianUruguayanUteVenezuelanVietnameseWelshWest IndianYakamaYaquiYugoslavianYumanYup'ikZimbabwean
Immigration
NonimmigrantsImmigrantsAfghanistanAfricaAlbaniaArgentinaArmeniaAsiaAustraliaAustriaBahamasBangladeshBarbadosBelarusBelgiumBelizeBoliviaBosnia and HerzegovinaBrazilBulgariaBurma/MyanmarCabo VerdeCambodiaCameroonCanadaCaribbeanCentral AmericaChileChinaColombiaCongoCosta RicaCroatiaCubaCzechoslovakiaDenmarkDominicaDominican RepublicEastern AfricaEastern AsiaEastern EuropeEcuadorEgyptEl SalvadorEnglandEritreaEthiopiaEuropeFijiFranceGermanyGhanaGreeceGrenadaGuatemalaGuyanaHaitiHondurasHong KongHungaryIndiaIndonesiaIranIraqIrelandIsraelItalyJamaicaJapanJordanKazakhstanKenyaKoreaKuwaitLaosLatin AmericaLatviaLebanonLiberiaLithuaniaMalaysiaMexicoMicronesiaMiddle AfricaMoldovaMoroccoNepalNetherlandsNicaraguaNigeriaNorth AmericaNorth MacedoniaNorthern AfricaNorthern EuropeNorwayOceaniaPakistanPanamaPeruPhilippinesPolandPortugalRomaniaRussiaSaudi ArabiaScotlandSenegalSerbiaSierra LeoneSingaporeSomaliaSouth AfricaSouth AmericaSouth Central AsiaSouth Eastern AsiaSouthern EuropeSpainSri LankaSt. Vincent and the GrenadinesSudanSwedenSwitzerlandSyriaTaiwanThailandTrinidad and TobagoTurkeyUgandaUkraineUruguayUzbekistanVenezuelaVietnamWest IndiesWestern AfricaWestern AsiaWestern EuropeYemenZaireZimbabweAzores
Iranian
Race
Ancestry
AfghanAfricanAlaska NativeAlaskan AthabascanAlbanianAleutAlsatianAmericanApacheArabArapahoArgentineanArmenianAssyrian/Chaldean/SyriacAustralianAustrianBahamianBangladeshiBarbadianBasqueBelgianBelizeanBermudanBhutaneseBlackfeetBolivianBrazilianBritishBritish West IndianBulgarianBurmeseCajunCambodianCanadianCape VerdeanCarpatho RusynCelticCentral AmericanCentral American IndianCherokeeCheyenneChickasawChileanChineseChippewaChoctawColombianColvilleComancheCosta RicanCreeCreekCroatianCrowCubanCypriotCzechCzechoslovakianDanishDelawareDominicanDutchDutch West IndianEastern EuropeanEcuadorianEgyptianEnglishEstonianEuropeanFijianFilipinoFinnishFrenchFrench American IndianFrench CanadianGermanGerman RussianGhanaianGreekGuamanian/ChamorroGuatemalanGuyaneseHaitianHmongHonduranHopiHoumaHungarianIcelanderIndian (Asian)IndonesianInupiatIranianIraqiIrishIroquoisIsraeliItalianJamaicanJapaneseJordanianKenyanKiowaKoreanLaotianLatvianLebaneseLiberianLithuanianLumbeeLuxembourgerMacedonianMalaysianMalteseMarshalleseMenomineeMexicanMexican American IndianMongolianMoroccanNative HawaiianNavajoNepaleseNew ZealanderNicaraguanNigerianNorthern EuropeanNorwegianOkinawanOsageOttawaPaiutePakistaniPalestinianPanamanianParaguayanPennsylvania GermanPeruvianPimaPolishPortuguesePotawatomiPuebloPuerto RicanPuget Sound SalishRomanianRussianSalvadoranSamoanScandinavianScotch-IrishScottishSeminoleSenegaleseSerbianShoshoneSierra LeoneanSiouxSlavicSlovakSloveneSomaliSouth AfricanSouth AmericanSouth American IndianSoviet UnionSpaniardSpanishSpanish AmericanSpanish American IndianSri LankanSubsaharan AfricanSudaneseSwedishSwissSyrianTaiwaneseThaiTlingit-HaidaTohono O'OdhamTonganTrinidadian and TobagonianTsimshianTurkishU.S. Virgin IslanderUgandanUkrainianUruguayanUteVenezuelanVietnameseWelshWest IndianYakamaYaquiYugoslavianYumanYup'ikZimbabwean
Immigration
NonimmigrantsImmigrantsAfghanistanAfricaAlbaniaArgentinaArmeniaAsiaAustraliaAustriaBahamasBangladeshBarbadosBelarusBelgiumBelizeBoliviaBosnia and HerzegovinaBrazilBulgariaBurma/MyanmarCabo VerdeCambodiaCameroonCanadaCaribbeanCentral AmericaChileChinaColombiaCongoCosta RicaCroatiaCubaCzechoslovakiaDenmarkDominicaDominican RepublicEastern AfricaEastern AsiaEastern EuropeEcuadorEgyptEl SalvadorEnglandEritreaEthiopiaEuropeFijiFranceGermanyGhanaGreeceGrenadaGuatemalaGuyanaHaitiHondurasHong KongHungaryIndiaIndonesiaIranIraqIrelandIsraelItalyJamaicaJapanJordanKazakhstanKenyaKoreaKuwaitLaosLatin AmericaLatviaLebanonLiberiaLithuaniaMalaysiaMexicoMicronesiaMiddle AfricaMoldovaMoroccoNepalNetherlandsNicaraguaNigeriaNorth AmericaNorth MacedoniaNorthern AfricaNorthern EuropeNorwayOceaniaPakistanPanamaPeruPhilippinesPolandPortugalRomaniaRussiaSaudi ArabiaScotlandSenegalSerbiaSierra LeoneSingaporeSomaliaSouth AfricaSouth AmericaSouth Central AsiaSouth Eastern AsiaSouthern EuropeSpainSri LankaSt. Vincent and the GrenadinesSudanSwedenSwitzerlandSyriaTaiwanThailandTrinidad and TobagoTurkeyUgandaUkraineUruguayUzbekistanVenezuelaVietnamWest IndiesWestern AfricaWestern AsiaWestern EuropeYemenZaireZimbabweAzores
Seniors Poverty Over the Age of 75
Income
Poverty
Unemployment
Labor Participation
Family Structure
Vehicle Availability
Education Level
Disability

Seniors Poverty Over the Age of 75 Comparison

Ethiopians

Iranians

Excellent
Exceptional
11.8%
SENIORS POVERTY OVER THE AGE OF 75
80.7/ 100
METRIC RATING
129th/ 347
METRIC RANK
11.5%
SENIORS POVERTY OVER THE AGE OF 75
95.1/ 100
METRIC RATING
82nd/ 347
METRIC RANK

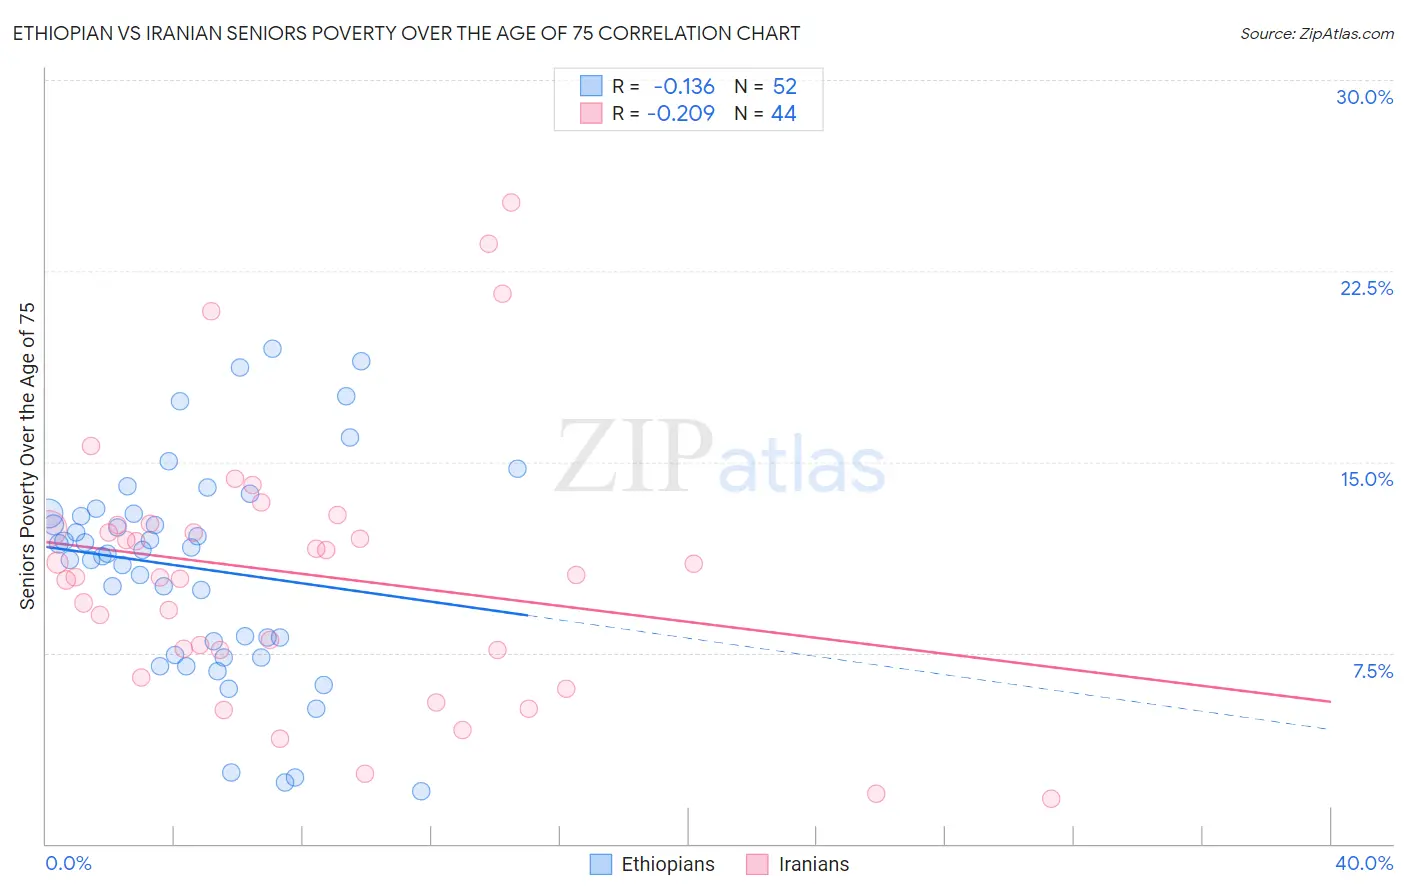
Ethiopian vs Iranian Seniors Poverty Over the Age of 75 Correlation Chart

The statistical analysis conducted on geographies consisting of 221,776,258 people shows a poor negative correlation between the proportion of Ethiopians and poverty level among seniors over the age of 75 in the United States with a correlation coefficient (R) of -0.136 and weighted average of 11.8%. Similarly, the statistical analysis conducted on geographies consisting of 314,002,652 people shows a weak negative correlation between the proportion of Iranians and poverty level among seniors over the age of 75 in the United States with a correlation coefficient (R) of -0.209 and weighted average of 11.5%, a difference of 3.3%.
Ethiopian vs Iranian Seniors Poverty Over the Age of 75

Seniors Poverty Over the Age of 75 Correlation Summary

MeasurementEthiopianIranian
Minimum2.1%1.7%
Maximum19.5%25.2%
Range17.4%23.4%
Mean10.8%10.6%
Median11.5%10.5%
Interquartile 25% (IQ1)7.7%7.6%
Interquartile 75% (IQ3)13.0%12.4%
Interquartile Range (IQR)5.3%4.8%
Standard Deviation (Sample)4.2%5.2%
Standard Deviation (Population)4.1%5.1%

Similar Demographics by Seniors Poverty Over the Age of 75

Demographics Similar to Ethiopians by Seniors Poverty Over the Age of 75

In terms of seniors poverty over the age of 75, the demographic groups most similar to Ethiopians are Spanish (11.8%, a difference of 0.020%), Immigrants from Western Europe (11.9%, a difference of 0.14%), Immigrants from Hungary (11.8%, a difference of 0.15%), Immigrants from Denmark (11.8%, a difference of 0.27%), and Lebanese (11.9%, a difference of 0.30%).
DemographicsRating | RankSeniors Poverty Over the Age of 75
Pakistanis
84.0
/100
|
#122
Excellent
11.8%
Immigrants | Italy
84.0
/100
|
#123
Excellent
11.8%
Fijians
83.8
/100
|
#124
Excellent
11.8%
Sudanese
83.6
/100
|
#125
Excellent
11.8%
Pennsylvania Germans
83.4
/100
|
#126
Excellent
11.8%
Immigrants | Denmark
82.6
/100
|
#127
Excellent
11.8%
Immigrants | Hungary
81.7
/100
|
#128
Excellent
11.8%
Ethiopians
80.7
/100
|
#129
Excellent
11.8%
Spanish
80.5
/100
|
#130
Excellent
11.8%
Immigrants | Western Europe
79.6
/100
|
#131
Good
11.9%
Lebanese
78.3
/100
|
#132
Good
11.9%
Immigrants | Sierra Leone
77.6
/100
|
#133
Good
11.9%
Ugandans
77.1
/100
|
#134
Good
11.9%
Immigrants | Ireland
76.2
/100
|
#135
Good
11.9%
Immigrants | Philippines
75.0
/100
|
#136
Good
11.9%

Demographics Similar to Iranians by Seniors Poverty Over the Age of 75

In terms of seniors poverty over the age of 75, the demographic groups most similar to Iranians are Basque (11.5%, a difference of 0.010%), Immigrants from South Africa (11.5%, a difference of 0.080%), Immigrants from Iraq (11.5%, a difference of 0.090%), Alaska Native (11.4%, a difference of 0.13%), and Macedonian (11.4%, a difference of 0.19%).
DemographicsRating | RankSeniors Poverty Over the Age of 75
Palestinians
95.8
/100
|
#75
Exceptional
11.4%
French Canadians
95.7
/100
|
#76
Exceptional
11.4%
Whites/Caucasians
95.5
/100
|
#77
Exceptional
11.4%
Macedonians
95.5
/100
|
#78
Exceptional
11.4%
Filipinos
95.5
/100
|
#79
Exceptional
11.4%
Alaska Natives
95.4
/100
|
#80
Exceptional
11.4%
Basques
95.1
/100
|
#81
Exceptional
11.5%
Iranians
95.1
/100
|
#82
Exceptional
11.5%
Immigrants | South Africa
94.9
/100
|
#83
Exceptional
11.5%
Immigrants | Iraq
94.9
/100
|
#84
Exceptional
11.5%
Immigrants | Bulgaria
94.7
/100
|
#85
Exceptional
11.5%
Australians
94.6
/100
|
#86
Exceptional
11.5%
Koreans
94.5
/100
|
#87
Exceptional
11.5%
Immigrants | Croatia
94.5
/100
|
#88
Exceptional
11.5%
Immigrants | Sri Lanka
94.4
/100
|
#89
Exceptional
11.5%