Ethiopian vs Arapaho Single Father Poverty
COMPARE
Ethiopian
Arapaho
Single Father Poverty
Single Father Poverty Comparison
Ethiopians
Arapaho
13.5%
SINGLE FATHER POVERTY
100.0/ 100
METRIC RATING
6th/ 347
METRIC RANK
24.0%
SINGLE FATHER POVERTY
0.0/ 100
METRIC RATING
338th/ 347
METRIC RANK
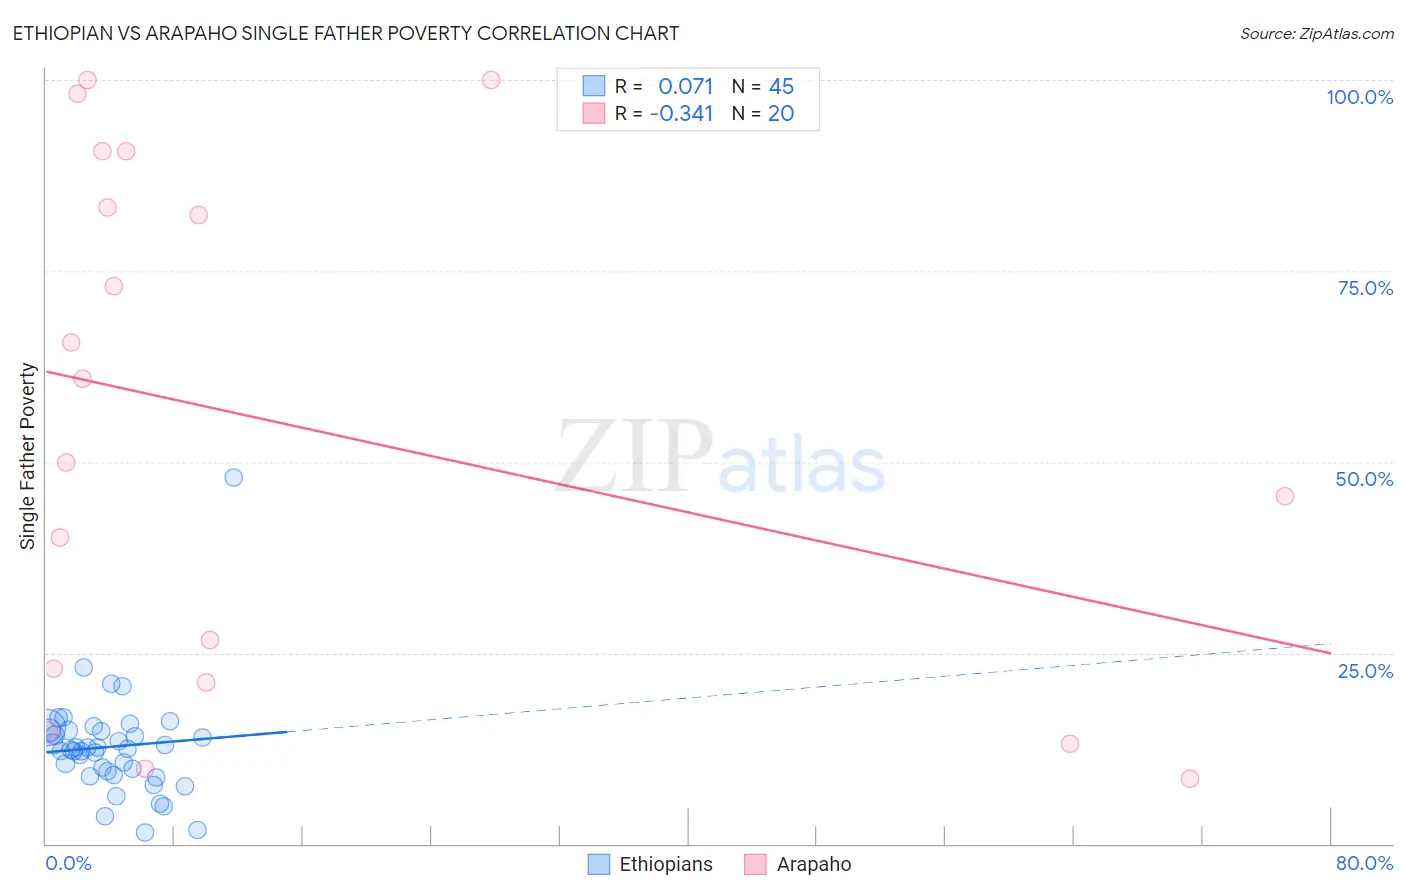
Ethiopian vs Arapaho Single Father Poverty Correlation Chart
The statistical analysis conducted on geographies consisting of 191,994,116 people shows a slight positive correlation between the proportion of Ethiopians and poverty level among single fathers in the United States with a correlation coefficient (R) of 0.071 and weighted average of 13.5%. Similarly, the statistical analysis conducted on geographies consisting of 28,107,372 people shows a mild negative correlation between the proportion of Arapaho and poverty level among single fathers in the United States with a correlation coefficient (R) of -0.341 and weighted average of 24.0%, a difference of 77.0%.
Single Father Poverty Correlation Summary
| Measurement | Ethiopian | Arapaho |
| Minimum | 1.5% | 8.5% |
| Maximum | 48.0% | 100.0% |
| Range | 46.5% | 91.5% |
| Mean | 12.7% | 54.8% |
| Median | 12.4% | 55.4% |
| Interquartile 25% (IQ1) | 9.3% | 22.0% |
| Interquartile 75% (IQ3) | 14.8% | 87.0% |
| Interquartile Range (IQR) | 5.6% | 65.0% |
| Standard Deviation (Sample) | 7.0% | 33.6% |
| Standard Deviation (Population) | 7.0% | 32.7% |
Similar Demographics by Single Father Poverty
Demographics Similar to Ethiopians by Single Father Poverty
In terms of single father poverty, the demographic groups most similar to Ethiopians are Immigrants from Ethiopia (13.4%, a difference of 0.77%), Immigrants from Taiwan (13.7%, a difference of 1.1%), Samoan (13.8%, a difference of 1.9%), Immigrants from Fiji (13.2%, a difference of 2.3%), and Afghan (14.0%, a difference of 3.0%).
| Demographics | Rating | Rank | Single Father Poverty |
| Assyrians/Chaldeans/Syriacs | 100.0 /100 | #1 | Exceptional 11.7% |
| Tongans | 100.0 /100 | #2 | Exceptional 12.2% |
| Tsimshian | 100.0 /100 | #3 | Exceptional 12.7% |
| Immigrants | Fiji | 100.0 /100 | #4 | Exceptional 13.2% |
| Immigrants | Ethiopia | 100.0 /100 | #5 | Exceptional 13.4% |
| Ethiopians | 100.0 /100 | #6 | Exceptional 13.5% |
| Immigrants | Taiwan | 100.0 /100 | #7 | Exceptional 13.7% |
| Samoans | 100.0 /100 | #8 | Exceptional 13.8% |
| Afghans | 100.0 /100 | #9 | Exceptional 14.0% |
| Koreans | 100.0 /100 | #10 | Exceptional 14.0% |
| Filipinos | 100.0 /100 | #11 | Exceptional 14.0% |
| Immigrants | India | 100.0 /100 | #12 | Exceptional 14.0% |
| Immigrants | Philippines | 100.0 /100 | #13 | Exceptional 14.0% |
| Immigrants | Vietnam | 100.0 /100 | #14 | Exceptional 14.1% |
| Sri Lankans | 100.0 /100 | #15 | Exceptional 14.2% |
Demographics Similar to Arapaho by Single Father Poverty
In terms of single father poverty, the demographic groups most similar to Arapaho are Sioux (23.9%, a difference of 0.41%), Apache (24.2%, a difference of 1.1%), Cajun (23.1%, a difference of 3.9%), Shoshone (22.9%, a difference of 4.6%), and Kiowa (22.5%, a difference of 6.7%).
| Demographics | Rating | Rank | Single Father Poverty |
| Central American Indians | 0.0 /100 | #331 | Tragic 21.7% |
| Tohono O'odham | 0.0 /100 | #332 | Tragic 22.0% |
| Natives/Alaskans | 0.0 /100 | #333 | Tragic 22.4% |
| Kiowa | 0.0 /100 | #334 | Tragic 22.5% |
| Shoshone | 0.0 /100 | #335 | Tragic 22.9% |
| Cajuns | 0.0 /100 | #336 | Tragic 23.1% |
| Sioux | 0.0 /100 | #337 | Tragic 23.9% |
| Arapaho | 0.0 /100 | #338 | Tragic 24.0% |
| Apache | 0.0 /100 | #339 | Tragic 24.2% |
| Houma | 0.0 /100 | #340 | Tragic 26.7% |
| Hopi | 0.0 /100 | #341 | Tragic 27.2% |
| Yuman | 0.0 /100 | #342 | Tragic 28.4% |
| Lumbee | 0.0 /100 | #343 | Tragic 28.5% |
| Navajo | 0.0 /100 | #344 | Tragic 29.2% |
| Crow | 0.0 /100 | #345 | Tragic 30.3% |