English vs Guamanian/Chamorro Child Poverty Under the Age of 5

COMPARE

English
Race
Ancestry
AfghanAfricanAlaska NativeAlaskan AthabascanAlbanianAleutAlsatianAmericanApacheArabArapahoArgentineanArmenianAssyrian/Chaldean/SyriacAustralianAustrianBahamianBangladeshiBarbadianBasqueBelgianBelizeanBermudanBhutaneseBlackfeetBolivianBrazilianBritishBritish West IndianBulgarianBurmeseCajunCambodianCanadianCape VerdeanCarpatho RusynCelticCentral AmericanCentral American IndianCherokeeCheyenneChickasawChileanChineseChippewaChoctawColombianColvilleComancheCosta RicanCreeCreekCroatianCrowCubanCypriotCzechCzechoslovakianDanishDelawareDominicanDutchDutch West IndianEastern EuropeanEcuadorianEgyptianEnglishEstonianEthiopianEuropeanFijianFilipinoFinnishFrenchFrench American IndianFrench CanadianGermanGerman RussianGhanaianGreekGuatemalanGuyaneseHaitianHmongHonduranHopiHoumaHungarianIcelanderIndian (Asian)IndonesianInupiatIranianIraqiIrishIroquoisIsraeliItalianJamaicanJapaneseJordanianKenyanKiowaKoreanLaotianLatvianLebaneseLiberianLithuanianLumbeeLuxembourgerMacedonianMalaysianMalteseMarshalleseMenomineeMexicanMexican American IndianMongolianMoroccanNative HawaiianNavajoNepaleseNew ZealanderNicaraguanNigerianNorthern EuropeanNorwegianOkinawanOsageOttawaPaiutePakistaniPalestinianPanamanianParaguayanPennsylvania GermanPeruvianPimaPolishPortuguesePotawatomiPuebloPuerto RicanPuget Sound SalishRomanianRussianSalvadoranSamoanScandinavianScotch-IrishScottishSeminoleSenegaleseSerbianShoshoneSierra LeoneanSiouxSlavicSlovakSloveneSomaliSouth AfricanSouth AmericanSouth American IndianSoviet UnionSpaniardSpanishSpanish AmericanSpanish American IndianSri LankanSubsaharan AfricanSudaneseSwedishSwissSyrianTaiwaneseThaiTlingit-HaidaTohono O'OdhamTonganTrinidadian and TobagonianTsimshianTurkishU.S. Virgin IslanderUgandanUkrainianUruguayanUteVenezuelanVietnameseWelshWest IndianYakamaYaquiYugoslavianYumanYup'ikZimbabwean
Immigration
NonimmigrantsImmigrantsAfghanistanAfricaAlbaniaArgentinaArmeniaAsiaAustraliaAustriaBahamasBangladeshBarbadosBelarusBelgiumBelizeBoliviaBosnia and HerzegovinaBrazilBulgariaBurma/MyanmarCabo VerdeCambodiaCameroonCanadaCaribbeanCentral AmericaChileChinaColombiaCongoCosta RicaCroatiaCubaCzechoslovakiaDenmarkDominicaDominican RepublicEastern AfricaEastern AsiaEastern EuropeEcuadorEgyptEl SalvadorEnglandEritreaEthiopiaEuropeFijiFranceGermanyGhanaGreeceGrenadaGuatemalaGuyanaHaitiHondurasHong KongHungaryIndiaIndonesiaIranIraqIrelandIsraelItalyJamaicaJapanJordanKazakhstanKenyaKoreaKuwaitLaosLatin AmericaLatviaLebanonLiberiaLithuaniaMalaysiaMexicoMicronesiaMiddle AfricaMoldovaMoroccoNepalNetherlandsNicaraguaNigeriaNorth AmericaNorth MacedoniaNorthern AfricaNorthern EuropeNorwayOceaniaPakistanPanamaPeruPhilippinesPolandPortugalRomaniaRussiaSaudi ArabiaScotlandSenegalSerbiaSierra LeoneSingaporeSomaliaSouth AfricaSouth AmericaSouth Central AsiaSouth Eastern AsiaSouthern EuropeSpainSri LankaSt. Vincent and the GrenadinesSudanSwedenSwitzerlandSyriaTaiwanThailandTrinidad and TobagoTurkeyUgandaUkraineUruguayUzbekistanVenezuelaVietnamWest IndiesWestern AfricaWestern AsiaWestern EuropeYemenZaireZimbabweAzores
Guamanian/Chamorro
Race
Ancestry
AfghanAfricanAlaska NativeAlaskan AthabascanAlbanianAleutAlsatianAmericanApacheArabArapahoArgentineanArmenianAssyrian/Chaldean/SyriacAustralianAustrianBahamianBangladeshiBarbadianBasqueBelgianBelizeanBermudanBhutaneseBlackfeetBolivianBrazilianBritishBritish West IndianBulgarianBurmeseCajunCambodianCanadianCape VerdeanCarpatho RusynCelticCentral AmericanCentral American IndianCherokeeCheyenneChickasawChileanChineseChippewaChoctawColombianColvilleComancheCosta RicanCreeCreekCroatianCrowCubanCypriotCzechCzechoslovakianDanishDelawareDominicanDutchDutch West IndianEastern EuropeanEcuadorianEgyptianEstonianEthiopianEuropeanFijianFilipinoFinnishFrenchFrench American IndianFrench CanadianGermanGerman RussianGhanaianGreekGuamanian/ChamorroGuatemalanGuyaneseHaitianHmongHonduranHopiHoumaHungarianIcelanderIndian (Asian)IndonesianInupiatIranianIraqiIrishIroquoisIsraeliItalianJamaicanJapaneseJordanianKenyanKiowaKoreanLaotianLatvianLebaneseLiberianLithuanianLumbeeLuxembourgerMacedonianMalaysianMalteseMarshalleseMenomineeMexicanMexican American IndianMongolianMoroccanNative HawaiianNavajoNepaleseNew ZealanderNicaraguanNigerianNorthern EuropeanNorwegianOkinawanOsageOttawaPaiutePakistaniPalestinianPanamanianParaguayanPennsylvania GermanPeruvianPimaPolishPortuguesePotawatomiPuebloPuerto RicanPuget Sound SalishRomanianRussianSalvadoranSamoanScandinavianScotch-IrishScottishSeminoleSenegaleseSerbianShoshoneSierra LeoneanSiouxSlavicSlovakSloveneSomaliSouth AfricanSouth AmericanSouth American IndianSoviet UnionSpaniardSpanishSpanish AmericanSpanish American IndianSri LankanSubsaharan AfricanSudaneseSwedishSwissSyrianTaiwaneseThaiTlingit-HaidaTohono O'OdhamTonganTrinidadian and TobagonianTsimshianTurkishU.S. Virgin IslanderUgandanUkrainianUruguayanUteVenezuelanVietnameseWelshWest IndianYakamaYaquiYugoslavianYumanYup'ikZimbabwean
Immigration
NonimmigrantsImmigrantsAfghanistanAfricaAlbaniaArgentinaArmeniaAsiaAustraliaAustriaBahamasBangladeshBarbadosBelarusBelgiumBelizeBoliviaBosnia and HerzegovinaBrazilBulgariaBurma/MyanmarCabo VerdeCambodiaCameroonCanadaCaribbeanCentral AmericaChileChinaColombiaCongoCosta RicaCroatiaCubaCzechoslovakiaDenmarkDominicaDominican RepublicEastern AfricaEastern AsiaEastern EuropeEcuadorEgyptEl SalvadorEnglandEritreaEthiopiaEuropeFijiFranceGermanyGhanaGreeceGrenadaGuatemalaGuyanaHaitiHondurasHong KongHungaryIndiaIndonesiaIranIraqIrelandIsraelItalyJamaicaJapanJordanKazakhstanKenyaKoreaKuwaitLaosLatin AmericaLatviaLebanonLiberiaLithuaniaMalaysiaMexicoMicronesiaMiddle AfricaMoldovaMoroccoNepalNetherlandsNicaraguaNigeriaNorth AmericaNorth MacedoniaNorthern AfricaNorthern EuropeNorwayOceaniaPakistanPanamaPeruPhilippinesPolandPortugalRomaniaRussiaSaudi ArabiaScotlandSenegalSerbiaSierra LeoneSingaporeSomaliaSouth AfricaSouth AmericaSouth Central AsiaSouth Eastern AsiaSouthern EuropeSpainSri LankaSt. Vincent and the GrenadinesSudanSwedenSwitzerlandSyriaTaiwanThailandTrinidad and TobagoTurkeyUgandaUkraineUruguayUzbekistanVenezuelaVietnamWest IndiesWestern AfricaWestern AsiaWestern EuropeYemenZaireZimbabweAzores
Child Poverty Under the Age of 5
Income
Poverty
Unemployment
Labor Participation
Family Structure
Vehicle Availability
Education Level
Disability

Child Poverty Under the Age of 5 Comparison

English

Guamanians/Chamorros

Good
Excellent
16.8%
CHILD POVERTY UNDER THE AGE OF 5
70.4/ 100
METRIC RATING
161st/ 347
METRIC RANK
16.5%
CHILD POVERTY UNDER THE AGE OF 5
84.2/ 100
METRIC RATING
140th/ 347
METRIC RANK

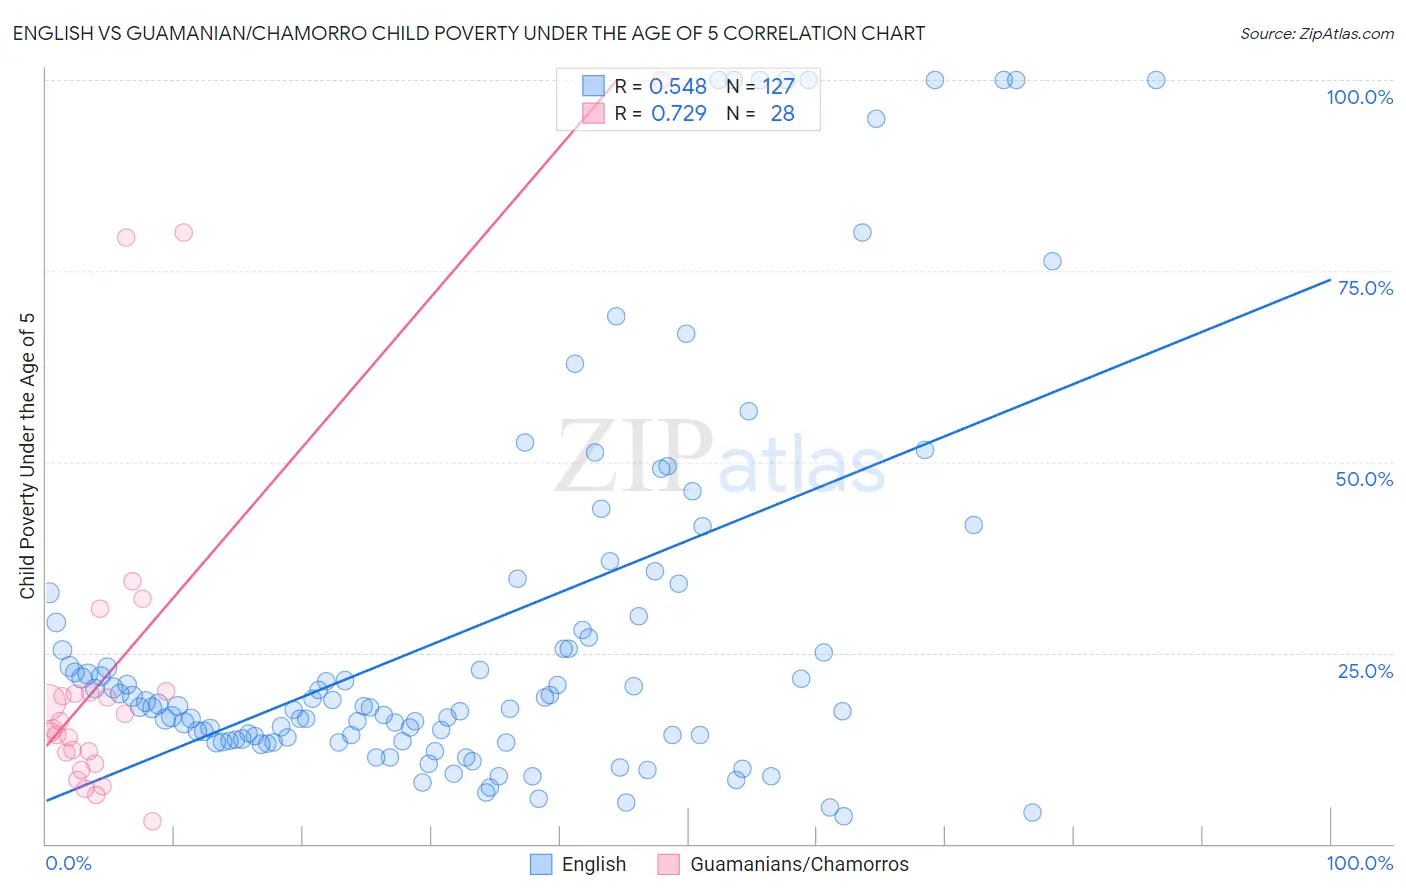
English vs Guamanian/Chamorro Child Poverty Under the Age of 5 Correlation Chart

The statistical analysis conducted on geographies consisting of 535,899,350 people shows a substantial positive correlation between the proportion of English and poverty level among children under the age of 5 in the United States with a correlation coefficient (R) of 0.548 and weighted average of 16.8%. Similarly, the statistical analysis conducted on geographies consisting of 218,115,058 people shows a strong positive correlation between the proportion of Guamanians/Chamorros and poverty level among children under the age of 5 in the United States with a correlation coefficient (R) of 0.729 and weighted average of 16.5%, a difference of 2.2%.
English vs Guamanian/Chamorro Child Poverty Under the Age of 5

Child Poverty Under the Age of 5 Correlation Summary

MeasurementEnglishGuamanian/Chamorro
Minimum3.5%3.0%
Maximum100.0%100.0%
Range96.5%97.0%
Mean28.1%23.3%
Median18.0%15.5%
Interquartile 25% (IQ1)13.6%11.2%
Interquartile 75% (IQ3)29.0%19.9%
Interquartile Range (IQR)15.4%8.6%
Standard Deviation (Sample)25.5%23.7%
Standard Deviation (Population)25.4%23.3%

Similar Demographics by Child Poverty Under the Age of 5

Demographics Similar to English by Child Poverty Under the Age of 5

In terms of child poverty under the age of 5, the demographic groups most similar to English are Costa Rican (16.9%, a difference of 0.060%), Scottish (16.9%, a difference of 0.21%), Irish (16.8%, a difference of 0.22%), Immigrants from Syria (16.8%, a difference of 0.25%), and Czechoslovakian (16.8%, a difference of 0.28%).
DemographicsRating | RankChild Poverty Under the Age of 5
Immigrants | Venezuela
76.0
/100
|
#154
Good
16.7%
South Americans
75.1
/100
|
#155
Good
16.7%
Afghans
74.4
/100
|
#156
Good
16.8%
Venezuelans
73.7
/100
|
#157
Good
16.8%
Czechoslovakians
72.5
/100
|
#158
Good
16.8%
Immigrants | Syria
72.3
/100
|
#159
Good
16.8%
Irish
72.0
/100
|
#160
Good
16.8%
English
70.4
/100
|
#161
Good
16.8%
Costa Ricans
69.8
/100
|
#162
Good
16.9%
Scottish
68.6
/100
|
#163
Good
16.9%
Immigrants | Oceania
67.6
/100
|
#164
Good
16.9%
Immigrants | Colombia
66.9
/100
|
#165
Good
16.9%
Slavs
64.0
/100
|
#166
Good
17.0%
Immigrants | Uzbekistan
62.0
/100
|
#167
Good
17.0%
Uruguayans
60.5
/100
|
#168
Good
17.0%

Demographics Similar to Guamanians/Chamorros by Child Poverty Under the Age of 5

In terms of child poverty under the age of 5, the demographic groups most similar to Guamanians/Chamorros are Immigrants from Hungary (16.5%, a difference of 0.070%), German (16.5%, a difference of 0.13%), Immigrants from Western Europe (16.5%, a difference of 0.19%), Immigrants from Chile (16.4%, a difference of 0.23%), and Portuguese (16.5%, a difference of 0.23%).
DemographicsRating | RankChild Poverty Under the Age of 5
Icelanders
87.9
/100
|
#133
Excellent
16.3%
Immigrants | North Macedonia
87.8
/100
|
#134
Excellent
16.4%
Brazilians
87.8
/100
|
#135
Excellent
16.4%
Immigrants | Northern Africa
87.5
/100
|
#136
Excellent
16.4%
Immigrants | Chile
85.3
/100
|
#137
Excellent
16.4%
Germans
84.8
/100
|
#138
Excellent
16.5%
Immigrants | Hungary
84.5
/100
|
#139
Excellent
16.5%
Guamanians/Chamorros
84.2
/100
|
#140
Excellent
16.5%
Immigrants | Western Europe
83.3
/100
|
#141
Excellent
16.5%
Portuguese
83.0
/100
|
#142
Excellent
16.5%
Samoans
83.0
/100
|
#143
Excellent
16.5%
Ethiopians
82.7
/100
|
#144
Excellent
16.5%
Immigrants | Ethiopia
82.1
/100
|
#145
Excellent
16.6%
Israelis
82.0
/100
|
#146
Excellent
16.6%
Immigrants | Nepal
80.3
/100
|
#147
Excellent
16.6%