Egyptian vs Polish Female Poverty
COMPARE
Egyptian
Polish
Female Poverty
Female Poverty Comparison
Egyptians
Poles
12.3%
FEMALE POVERTY
97.2/ 100
METRIC RATING
78th/ 347
METRIC RANK
11.7%
FEMALE POVERTY
99.5/ 100
METRIC RATING
31st/ 347
METRIC RANK
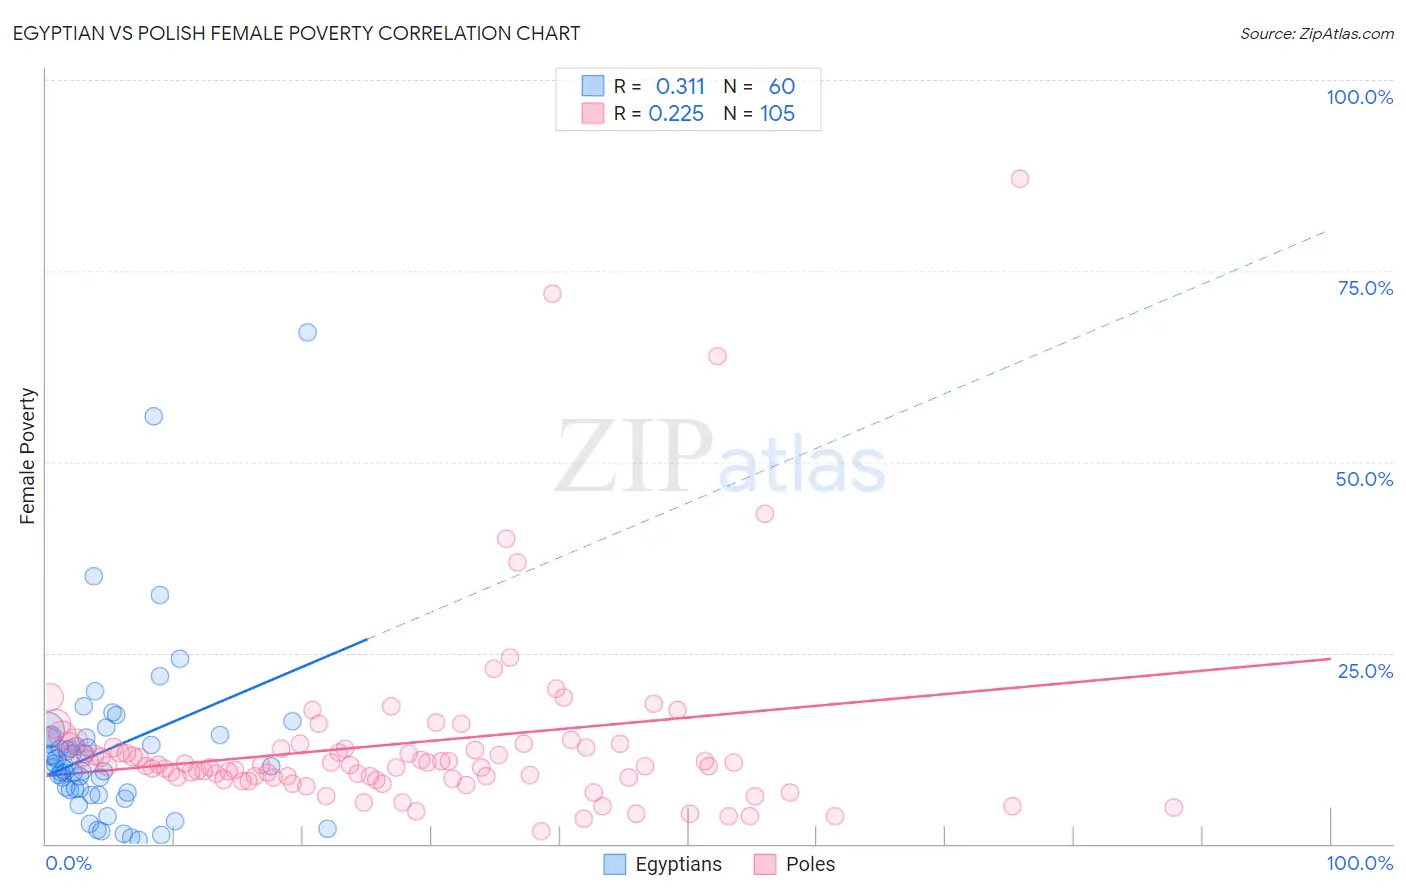
Egyptian vs Polish Female Poverty Correlation Chart
The statistical analysis conducted on geographies consisting of 276,729,469 people shows a mild positive correlation between the proportion of Egyptians and poverty level among females in the United States with a correlation coefficient (R) of 0.311 and weighted average of 12.3%. Similarly, the statistical analysis conducted on geographies consisting of 559,323,396 people shows a weak positive correlation between the proportion of Poles and poverty level among females in the United States with a correlation coefficient (R) of 0.225 and weighted average of 11.7%, a difference of 4.8%.
Female Poverty Correlation Summary
| Measurement | Egyptian | Polish |
| Minimum | 0.56% | 1.6% |
| Maximum | 66.9% | 87.1% |
| Range | 66.4% | 85.5% |
| Mean | 12.4% | 13.1% |
| Median | 10.1% | 10.3% |
| Interquartile 25% (IQ1) | 6.9% | 8.6% |
| Interquartile 75% (IQ3) | 14.0% | 12.8% |
| Interquartile Range (IQR) | 7.1% | 4.3% |
| Standard Deviation (Sample) | 11.5% | 12.4% |
| Standard Deviation (Population) | 11.4% | 12.4% |
Similar Demographics by Female Poverty
Demographics Similar to Egyptians by Female Poverty
In terms of female poverty, the demographic groups most similar to Egyptians are Serbian (12.3%, a difference of 0.010%), Immigrants from Eastern Europe (12.3%, a difference of 0.040%), Immigrants from North America (12.3%, a difference of 0.070%), Slovak (12.3%, a difference of 0.12%), and Immigrants from Sweden (12.3%, a difference of 0.12%).
| Demographics | Rating | Rank | Female Poverty |
| Carpatho Rusyns | 97.6 /100 | #71 | Exceptional 12.2% |
| Cambodians | 97.5 /100 | #72 | Exceptional 12.2% |
| Zimbabweans | 97.5 /100 | #73 | Exceptional 12.3% |
| Immigrants | Canada | 97.5 /100 | #74 | Exceptional 12.3% |
| Europeans | 97.4 /100 | #75 | Exceptional 12.3% |
| Immigrants | Eastern Europe | 97.2 /100 | #76 | Exceptional 12.3% |
| Serbians | 97.2 /100 | #77 | Exceptional 12.3% |
| Egyptians | 97.2 /100 | #78 | Exceptional 12.3% |
| Immigrants | North America | 97.1 /100 | #79 | Exceptional 12.3% |
| Slovaks | 97.1 /100 | #80 | Exceptional 12.3% |
| Immigrants | Sweden | 97.1 /100 | #81 | Exceptional 12.3% |
| Jordanians | 97.1 /100 | #82 | Exceptional 12.3% |
| Immigrants | England | 96.9 /100 | #83 | Exceptional 12.3% |
| Northern Europeans | 96.6 /100 | #84 | Exceptional 12.4% |
| Irish | 96.5 /100 | #85 | Exceptional 12.4% |
Demographics Similar to Poles by Female Poverty
In terms of female poverty, the demographic groups most similar to Poles are Danish (11.7%, a difference of 0.13%), Cypriot (11.8%, a difference of 0.21%), Greek (11.7%, a difference of 0.22%), Immigrants from North Macedonia (11.7%, a difference of 0.30%), and Immigrants from Singapore (11.8%, a difference of 0.32%).
| Demographics | Rating | Rank | Female Poverty |
| Luxembourgers | 99.7 /100 | #24 | Exceptional 11.6% |
| Immigrants | Northern Europe | 99.6 /100 | #25 | Exceptional 11.6% |
| Croatians | 99.6 /100 | #26 | Exceptional 11.6% |
| Iranians | 99.6 /100 | #27 | Exceptional 11.7% |
| Immigrants | Korea | 99.6 /100 | #28 | Exceptional 11.7% |
| Immigrants | North Macedonia | 99.6 /100 | #29 | Exceptional 11.7% |
| Greeks | 99.5 /100 | #30 | Exceptional 11.7% |
| Poles | 99.5 /100 | #31 | Exceptional 11.7% |
| Danes | 99.5 /100 | #32 | Exceptional 11.7% |
| Cypriots | 99.5 /100 | #33 | Exceptional 11.8% |
| Immigrants | Singapore | 99.4 /100 | #34 | Exceptional 11.8% |
| Immigrants | Iran | 99.4 /100 | #35 | Exceptional 11.8% |
| Immigrants | Pakistan | 99.4 /100 | #36 | Exceptional 11.8% |
| Immigrants | Greece | 99.3 /100 | #37 | Exceptional 11.8% |
| Russians | 99.3 /100 | #38 | Exceptional 11.8% |