Egyptian vs Immigrants from Egypt Family Poverty

COMPARE

Egyptian
Race
Ancestry
AfghanAfricanAlaska NativeAlaskan AthabascanAlbanianAleutAlsatianAmericanApacheArabArapahoArgentineanArmenianAssyrian/Chaldean/SyriacAustralianAustrianBahamianBangladeshiBarbadianBasqueBelgianBelizeanBermudanBhutaneseBlackfeetBolivianBrazilianBritishBritish West IndianBulgarianBurmeseCajunCambodianCanadianCape VerdeanCarpatho RusynCelticCentral AmericanCentral American IndianCherokeeCheyenneChickasawChileanChineseChippewaChoctawColombianColvilleComancheCosta RicanCreeCreekCroatianCrowCubanCypriotCzechCzechoslovakianDanishDelawareDominicanDutchDutch West IndianEastern EuropeanEcuadorianEgyptianEnglishEstonianEthiopianEuropeanFijianFilipinoFinnishFrenchFrench American IndianFrench CanadianGermanGerman RussianGhanaianGreekGuamanian/ChamorroGuatemalanGuyaneseHaitianHmongHonduranHopiHoumaHungarianIcelanderIndian (Asian)IndonesianInupiatIranianIraqiIrishIroquoisIsraeliItalianJamaicanJapaneseJordanianKenyanKiowaKoreanLaotianLatvianLebaneseLiberianLithuanianLumbeeLuxembourgerMacedonianMalaysianMalteseMarshalleseMenomineeMexicanMexican American IndianMongolianMoroccanNative HawaiianNavajoNepaleseNew ZealanderNicaraguanNigerianNorthern EuropeanNorwegianOkinawanOsageOttawaPaiutePakistaniPalestinianPanamanianParaguayanPennsylvania GermanPeruvianPimaPolishPortuguesePotawatomiPuebloPuerto RicanPuget Sound SalishRomanianRussianSalvadoranSamoanScandinavianScotch-IrishScottishSeminoleSenegaleseSerbianShoshoneSierra LeoneanSiouxSlavicSlovakSloveneSomaliSouth AfricanSouth AmericanSouth American IndianSoviet UnionSpaniardSpanishSpanish AmericanSpanish American IndianSri LankanSubsaharan AfricanSudaneseSwedishSwissSyrianTaiwaneseThaiTlingit-HaidaTohono O'OdhamTonganTrinidadian and TobagonianTsimshianTurkishU.S. Virgin IslanderUgandanUkrainianUruguayanUteVenezuelanVietnameseWelshWest IndianYakamaYaquiYugoslavianYumanYup'ikZimbabwean
Immigration
NonimmigrantsImmigrantsAfghanistanAfricaAlbaniaArgentinaArmeniaAsiaAustraliaAustriaBahamasBangladeshBarbadosBelarusBelgiumBelizeBoliviaBosnia and HerzegovinaBrazilBulgariaBurma/MyanmarCabo VerdeCambodiaCameroonCanadaCaribbeanCentral AmericaChileChinaColombiaCongoCosta RicaCroatiaCubaCzechoslovakiaDenmarkDominicaDominican RepublicEastern AfricaEastern AsiaEastern EuropeEcuadorEl SalvadorEnglandEritreaEthiopiaEuropeFijiFranceGermanyGhanaGreeceGrenadaGuatemalaGuyanaHaitiHondurasHong KongHungaryIndiaIndonesiaIranIraqIrelandIsraelItalyJamaicaJapanJordanKazakhstanKenyaKoreaKuwaitLaosLatin AmericaLatviaLebanonLiberiaLithuaniaMalaysiaMexicoMicronesiaMiddle AfricaMoldovaMoroccoNepalNetherlandsNicaraguaNigeriaNorth AmericaNorth MacedoniaNorthern AfricaNorthern EuropeNorwayOceaniaPakistanPanamaPeruPhilippinesPolandPortugalRomaniaRussiaSaudi ArabiaScotlandSenegalSerbiaSierra LeoneSingaporeSomaliaSouth AfricaSouth AmericaSouth Central AsiaSouth Eastern AsiaSouthern EuropeSpainSri LankaSt. Vincent and the GrenadinesSudanSwedenSwitzerlandSyriaTaiwanThailandTrinidad and TobagoTurkeyUgandaUkraineUruguayUzbekistanVenezuelaVietnamWest IndiesWestern AfricaWestern AsiaWestern EuropeYemenZaireZimbabweAzores
Immigrants from Egypt
Race
Ancestry
AfghanAfricanAlaska NativeAlaskan AthabascanAlbanianAleutAlsatianAmericanApacheArabArapahoArgentineanArmenianAssyrian/Chaldean/SyriacAustralianAustrianBahamianBangladeshiBarbadianBasqueBelgianBelizeanBermudanBhutaneseBlackfeetBolivianBrazilianBritishBritish West IndianBulgarianBurmeseCajunCambodianCanadianCape VerdeanCarpatho RusynCelticCentral AmericanCentral American IndianCherokeeCheyenneChickasawChileanChineseChippewaChoctawColombianColvilleComancheCosta RicanCreeCreekCroatianCrowCubanCypriotCzechCzechoslovakianDanishDelawareDominicanDutchDutch West IndianEastern EuropeanEcuadorianEnglishEstonianEthiopianEuropeanFijianFilipinoFinnishFrenchFrench American IndianFrench CanadianGermanGerman RussianGhanaianGreekGuamanian/ChamorroGuatemalanGuyaneseHaitianHmongHonduranHopiHoumaHungarianIcelanderIndian (Asian)IndonesianInupiatIranianIraqiIrishIroquoisIsraeliItalianJamaicanJapaneseJordanianKenyanKiowaKoreanLaotianLatvianLebaneseLiberianLithuanianLumbeeLuxembourgerMacedonianMalaysianMalteseMarshalleseMenomineeMexicanMexican American IndianMongolianMoroccanNative HawaiianNavajoNepaleseNew ZealanderNicaraguanNigerianNorthern EuropeanNorwegianOkinawanOsageOttawaPaiutePakistaniPalestinianPanamanianParaguayanPennsylvania GermanPeruvianPimaPolishPortuguesePotawatomiPuebloPuerto RicanPuget Sound SalishRomanianRussianSalvadoranSamoanScandinavianScotch-IrishScottishSeminoleSenegaleseSerbianShoshoneSierra LeoneanSiouxSlavicSlovakSloveneSomaliSouth AfricanSouth AmericanSouth American IndianSoviet UnionSpaniardSpanishSpanish AmericanSpanish American IndianSri LankanSubsaharan AfricanSudaneseSwedishSwissSyrianTaiwaneseThaiTlingit-HaidaTohono O'OdhamTonganTrinidadian and TobagonianTsimshianTurkishU.S. Virgin IslanderUgandanUkrainianUruguayanUteVenezuelanVietnameseWelshWest IndianYakamaYaquiYugoslavianYumanYup'ikZimbabwean
Immigration
NonimmigrantsImmigrantsAfghanistanAfricaAlbaniaArgentinaArmeniaAsiaAustraliaAustriaBahamasBangladeshBarbadosBelarusBelgiumBelizeBoliviaBosnia and HerzegovinaBrazilBulgariaBurma/MyanmarCabo VerdeCambodiaCameroonCanadaCaribbeanCentral AmericaChileChinaColombiaCongoCosta RicaCroatiaCubaCzechoslovakiaDenmarkDominicaDominican RepublicEastern AfricaEastern AsiaEastern EuropeEcuadorEgyptEl SalvadorEnglandEritreaEthiopiaEuropeFijiFranceGermanyGhanaGreeceGrenadaGuatemalaGuyanaHaitiHondurasHong KongHungaryIndiaIndonesiaIranIraqIrelandIsraelItalyJamaicaJapanJordanKazakhstanKenyaKoreaKuwaitLaosLatin AmericaLatviaLebanonLiberiaLithuaniaMalaysiaMexicoMicronesiaMiddle AfricaMoldovaMoroccoNepalNetherlandsNicaraguaNigeriaNorth AmericaNorth MacedoniaNorthern AfricaNorthern EuropeNorwayOceaniaPakistanPanamaPeruPhilippinesPolandPortugalRomaniaRussiaSaudi ArabiaScotlandSenegalSerbiaSierra LeoneSingaporeSomaliaSouth AfricaSouth AmericaSouth Central AsiaSouth Eastern AsiaSouthern EuropeSpainSri LankaSt. Vincent and the GrenadinesSudanSwedenSwitzerlandSyriaTaiwanThailandTrinidad and TobagoTurkeyUgandaUkraineUruguayUzbekistanVenezuelaVietnamWest IndiesWestern AfricaWestern AsiaWestern EuropeYemenZaireZimbabweAzores
Family Poverty
Income
Poverty
Unemployment
Labor Participation
Family Structure
Vehicle Availability
Education Level
Disability

Family Poverty Comparison

Egyptians

Immigrants from Egypt

Exceptional
Exceptional
8.1%
FAMILY POVERTY
95.1/ 100
METRIC RATING
106th/ 347
METRIC RANK
8.3%
FAMILY POVERTY
91.6/ 100
METRIC RATING
120th/ 347
METRIC RANK

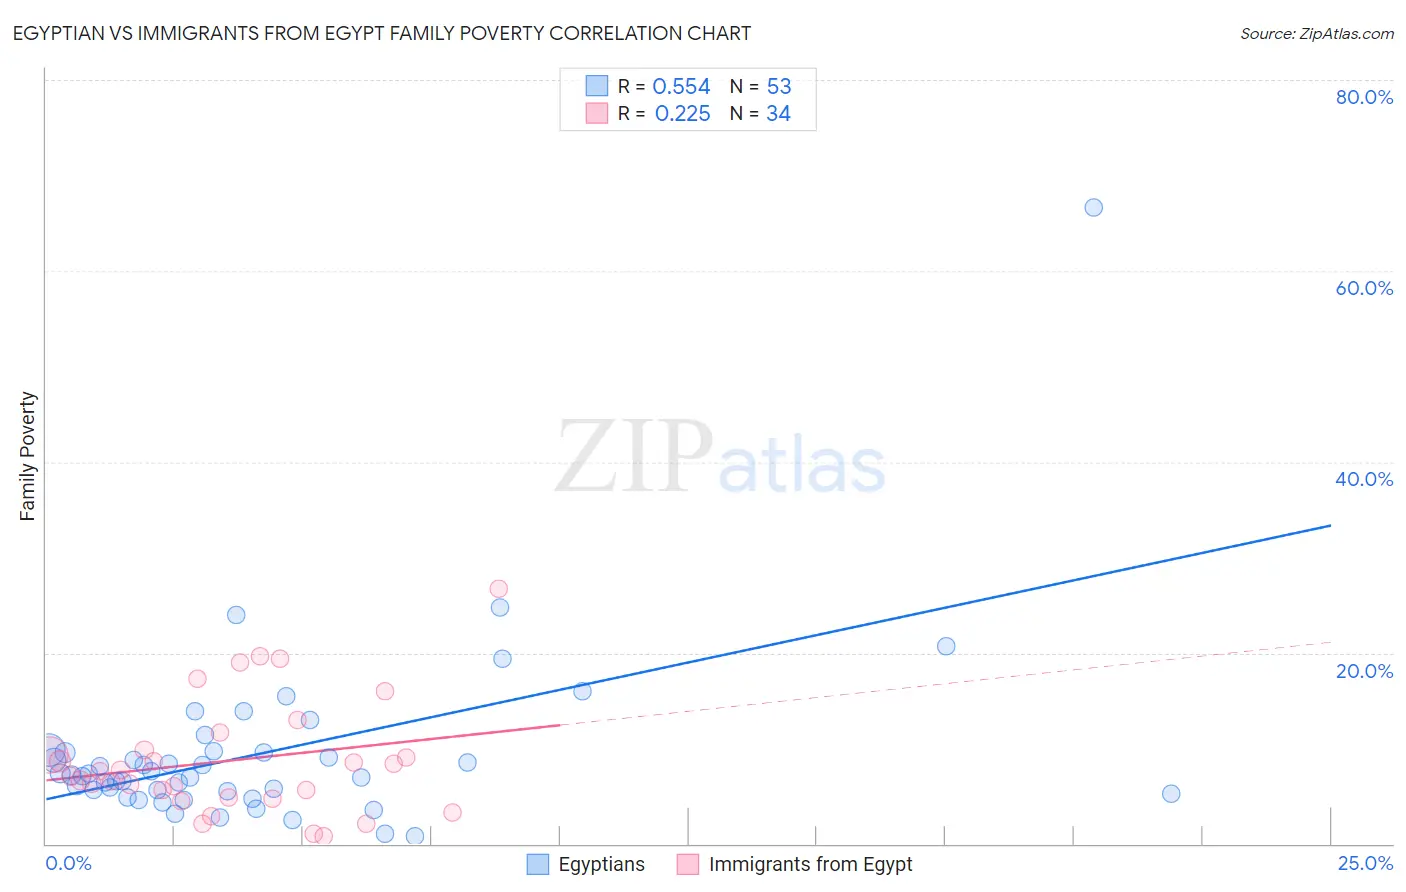
Egyptian vs Immigrants from Egypt Family Poverty Correlation Chart

The statistical analysis conducted on geographies consisting of 276,431,848 people shows a substantial positive correlation between the proportion of Egyptians and poverty level among families in the United States with a correlation coefficient (R) of 0.554 and weighted average of 8.1%. Similarly, the statistical analysis conducted on geographies consisting of 245,176,811 people shows a weak positive correlation between the proportion of Immigrants from Egypt and poverty level among families in the United States with a correlation coefficient (R) of 0.225 and weighted average of 8.3%, a difference of 2.0%.
Egyptian vs Immigrants from Egypt Family Poverty

Family Poverty Correlation Summary

MeasurementEgyptianImmigrants from Egypt
Minimum0.78%0.80%
Maximum66.7%26.7%
Range65.9%25.9%
Mean9.5%8.7%
Median7.2%7.3%
Interquartile 25% (IQ1)5.4%4.9%
Interquartile 75% (IQ3)9.6%9.8%
Interquartile Range (IQR)4.3%4.9%
Standard Deviation (Sample)9.5%6.0%
Standard Deviation (Population)9.4%5.9%

Demographics Similar to Egyptians and Immigrants from Egypt by Family Poverty

In terms of family poverty, the demographic groups most similar to Egyptians are French Canadian (8.1%, a difference of 0.040%), Basque (8.1%, a difference of 0.13%), Jordanian (8.2%, a difference of 0.22%), Romanian (8.2%, a difference of 0.31%), and Taiwanese (8.2%, a difference of 0.36%). Similarly, the demographic groups most similar to Immigrants from Egypt are Native Hawaiian (8.3%, a difference of 0.17%), Paraguayan (8.3%, a difference of 0.18%), Palestinian (8.3%, a difference of 0.25%), French (8.3%, a difference of 0.56%), and Immigrants from Western Europe (8.2%, a difference of 0.63%).
DemographicsRating | RankFamily Poverty
Immigrants | Eastern Europe
95.6
/100
|
#103
Exceptional
8.1%
Slavs
95.6
/100
|
#104
Exceptional
8.1%
Laotians
95.6
/100
|
#105
Exceptional
8.1%
Egyptians
95.1
/100
|
#106
Exceptional
8.1%
French Canadians
95.0
/100
|
#107
Exceptional
8.1%
Basques
94.9
/100
|
#108
Exceptional
8.1%
Jordanians
94.8
/100
|
#109
Exceptional
8.2%
Romanians
94.7
/100
|
#110
Exceptional
8.2%
Taiwanese
94.6
/100
|
#111
Exceptional
8.2%
Immigrants | France
94.4
/100
|
#112
Exceptional
8.2%
Canadians
94.2
/100
|
#113
Exceptional
8.2%
Immigrants | Zimbabwe
94.0
/100
|
#114
Exceptional
8.2%
Immigrants | Israel
93.5
/100
|
#115
Exceptional
8.2%
South Africans
93.4
/100
|
#116
Exceptional
8.2%
Immigrants | Russia
93.2
/100
|
#117
Exceptional
8.2%
Immigrants | Western Europe
92.9
/100
|
#118
Exceptional
8.2%
French
92.8
/100
|
#119
Exceptional
8.3%
Immigrants | Egypt
91.6
/100
|
#120
Exceptional
8.3%
Native Hawaiians
91.3
/100
|
#121
Exceptional
8.3%
Paraguayans
91.2
/100
|
#122
Exceptional
8.3%
Palestinians
91.1
/100
|
#123
Exceptional
8.3%