Ecuadorian vs Immigrants from Eastern Europe Female Poverty

COMPARE

Ecuadorian
Race
Ancestry
AfghanAfricanAlaska NativeAlaskan AthabascanAlbanianAleutAlsatianAmericanApacheArabArapahoArgentineanArmenianAssyrian/Chaldean/SyriacAustralianAustrianBahamianBangladeshiBarbadianBasqueBelgianBelizeanBermudanBhutaneseBlackfeetBolivianBrazilianBritishBritish West IndianBulgarianBurmeseCajunCambodianCanadianCape VerdeanCarpatho RusynCelticCentral AmericanCentral American IndianCherokeeCheyenneChickasawChileanChineseChippewaChoctawColombianColvilleComancheCosta RicanCreeCreekCroatianCrowCubanCypriotCzechCzechoslovakianDanishDelawareDominicanDutchDutch West IndianEastern EuropeanEcuadorianEgyptianEnglishEstonianEthiopianEuropeanFijianFilipinoFinnishFrenchFrench American IndianFrench CanadianGermanGerman RussianGhanaianGreekGuamanian/ChamorroGuatemalanGuyaneseHaitianHmongHonduranHopiHoumaHungarianIcelanderIndian (Asian)IndonesianInupiatIranianIraqiIrishIroquoisIsraeliItalianJamaicanJapaneseJordanianKenyanKiowaKoreanLaotianLatvianLebaneseLiberianLithuanianLumbeeLuxembourgerMacedonianMalaysianMalteseMarshalleseMenomineeMexicanMexican American IndianMongolianMoroccanNative HawaiianNavajoNepaleseNew ZealanderNicaraguanNigerianNorthern EuropeanNorwegianOkinawanOsageOttawaPaiutePakistaniPalestinianPanamanianParaguayanPennsylvania GermanPeruvianPimaPolishPortuguesePotawatomiPuebloPuerto RicanPuget Sound SalishRomanianRussianSalvadoranSamoanScandinavianScotch-IrishScottishSeminoleSenegaleseSerbianShoshoneSierra LeoneanSiouxSlavicSlovakSloveneSomaliSouth AfricanSouth AmericanSouth American IndianSoviet UnionSpaniardSpanishSpanish AmericanSpanish American IndianSri LankanSubsaharan AfricanSudaneseSwedishSwissSyrianTaiwaneseThaiTlingit-HaidaTohono O'OdhamTonganTrinidadian and TobagonianTsimshianTurkishU.S. Virgin IslanderUgandanUkrainianUruguayanUteVenezuelanVietnameseWelshWest IndianYakamaYaquiYugoslavianYumanYup'ikZimbabwean
Immigration
NonimmigrantsImmigrantsAfghanistanAfricaAlbaniaArgentinaArmeniaAsiaAustraliaAustriaBahamasBangladeshBarbadosBelarusBelgiumBelizeBoliviaBosnia and HerzegovinaBrazilBulgariaBurma/MyanmarCabo VerdeCambodiaCameroonCanadaCaribbeanCentral AmericaChileChinaColombiaCongoCosta RicaCroatiaCubaCzechoslovakiaDenmarkDominicaDominican RepublicEastern AfricaEastern AsiaEcuadorEgyptEl SalvadorEnglandEritreaEthiopiaEuropeFijiFranceGermanyGhanaGreeceGrenadaGuatemalaGuyanaHaitiHondurasHong KongHungaryIndiaIndonesiaIranIraqIrelandIsraelItalyJamaicaJapanJordanKazakhstanKenyaKoreaKuwaitLaosLatin AmericaLatviaLebanonLiberiaLithuaniaMalaysiaMexicoMicronesiaMiddle AfricaMoldovaMoroccoNepalNetherlandsNicaraguaNigeriaNorth AmericaNorth MacedoniaNorthern AfricaNorthern EuropeNorwayOceaniaPakistanPanamaPeruPhilippinesPolandPortugalRomaniaRussiaSaudi ArabiaScotlandSenegalSerbiaSierra LeoneSingaporeSomaliaSouth AfricaSouth AmericaSouth Central AsiaSouth Eastern AsiaSouthern EuropeSpainSri LankaSt. Vincent and the GrenadinesSudanSwedenSwitzerlandSyriaTaiwanThailandTrinidad and TobagoTurkeyUgandaUkraineUruguayUzbekistanVenezuelaVietnamWest IndiesWestern AfricaWestern AsiaWestern EuropeYemenZaireZimbabweAzores
Immigrants from Eastern Europe
Race
Ancestry
AfghanAfricanAlaska NativeAlaskan AthabascanAlbanianAleutAlsatianAmericanApacheArabArapahoArgentineanArmenianAssyrian/Chaldean/SyriacAustralianAustrianBahamianBangladeshiBarbadianBasqueBelgianBelizeanBermudanBhutaneseBlackfeetBolivianBrazilianBritishBritish West IndianBulgarianBurmeseCajunCambodianCanadianCape VerdeanCarpatho RusynCelticCentral AmericanCentral American IndianCherokeeCheyenneChickasawChileanChineseChippewaChoctawColombianColvilleComancheCosta RicanCreeCreekCroatianCrowCubanCypriotCzechCzechoslovakianDanishDelawareDominicanDutchDutch West IndianEastern EuropeanEgyptianEnglishEstonianEthiopianEuropeanFijianFilipinoFinnishFrenchFrench American IndianFrench CanadianGermanGerman RussianGhanaianGreekGuamanian/ChamorroGuatemalanGuyaneseHaitianHmongHonduranHopiHoumaHungarianIcelanderIndian (Asian)IndonesianInupiatIranianIraqiIrishIroquoisIsraeliItalianJamaicanJapaneseJordanianKenyanKiowaKoreanLaotianLatvianLebaneseLiberianLithuanianLumbeeLuxembourgerMacedonianMalaysianMalteseMarshalleseMenomineeMexicanMexican American IndianMongolianMoroccanNative HawaiianNavajoNepaleseNew ZealanderNicaraguanNigerianNorthern EuropeanNorwegianOkinawanOsageOttawaPaiutePakistaniPalestinianPanamanianParaguayanPennsylvania GermanPeruvianPimaPolishPortuguesePotawatomiPuebloPuerto RicanPuget Sound SalishRomanianRussianSalvadoranSamoanScandinavianScotch-IrishScottishSeminoleSenegaleseSerbianShoshoneSierra LeoneanSiouxSlavicSlovakSloveneSomaliSouth AfricanSouth AmericanSouth American IndianSoviet UnionSpaniardSpanishSpanish AmericanSpanish American IndianSri LankanSubsaharan AfricanSudaneseSwedishSwissSyrianTaiwaneseThaiTlingit-HaidaTohono O'OdhamTonganTrinidadian and TobagonianTsimshianTurkishU.S. Virgin IslanderUgandanUkrainianUruguayanUteVenezuelanVietnameseWelshWest IndianYakamaYaquiYugoslavianYumanYup'ikZimbabwean
Immigration
NonimmigrantsImmigrantsAfghanistanAfricaAlbaniaArgentinaArmeniaAsiaAustraliaAustriaBahamasBangladeshBarbadosBelarusBelgiumBelizeBoliviaBosnia and HerzegovinaBrazilBulgariaBurma/MyanmarCabo VerdeCambodiaCameroonCanadaCaribbeanCentral AmericaChileChinaColombiaCongoCosta RicaCroatiaCubaCzechoslovakiaDenmarkDominicaDominican RepublicEastern AfricaEastern AsiaEastern EuropeEcuadorEgyptEl SalvadorEnglandEritreaEthiopiaEuropeFijiFranceGermanyGhanaGreeceGrenadaGuatemalaGuyanaHaitiHondurasHong KongHungaryIndiaIndonesiaIranIraqIrelandIsraelItalyJamaicaJapanJordanKazakhstanKenyaKoreaKuwaitLaosLatin AmericaLatviaLebanonLiberiaLithuaniaMalaysiaMexicoMicronesiaMiddle AfricaMoldovaMoroccoNepalNetherlandsNicaraguaNigeriaNorth AmericaNorth MacedoniaNorthern AfricaNorthern EuropeNorwayOceaniaPakistanPanamaPeruPhilippinesPolandPortugalRomaniaRussiaSaudi ArabiaScotlandSenegalSerbiaSierra LeoneSingaporeSomaliaSouth AfricaSouth AmericaSouth Central AsiaSouth Eastern AsiaSouthern EuropeSpainSri LankaSt. Vincent and the GrenadinesSudanSwedenSwitzerlandSyriaTaiwanThailandTrinidad and TobagoTurkeyUgandaUkraineUruguayUzbekistanVenezuelaVietnamWest IndiesWestern AfricaWestern AsiaWestern EuropeYemenZaireZimbabweAzores
Female Poverty
Income
Poverty
Unemployment
Labor Participation
Family Structure
Vehicle Availability
Education Level
Disability

Female Poverty Comparison

Ecuadorians

Immigrants from Eastern Europe

Tragic
Exceptional
15.3%
FEMALE POVERTY
0.3/ 100
METRIC RATING
244th/ 347
METRIC RANK
12.3%
FEMALE POVERTY
97.2/ 100
METRIC RATING
76th/ 347
METRIC RANK

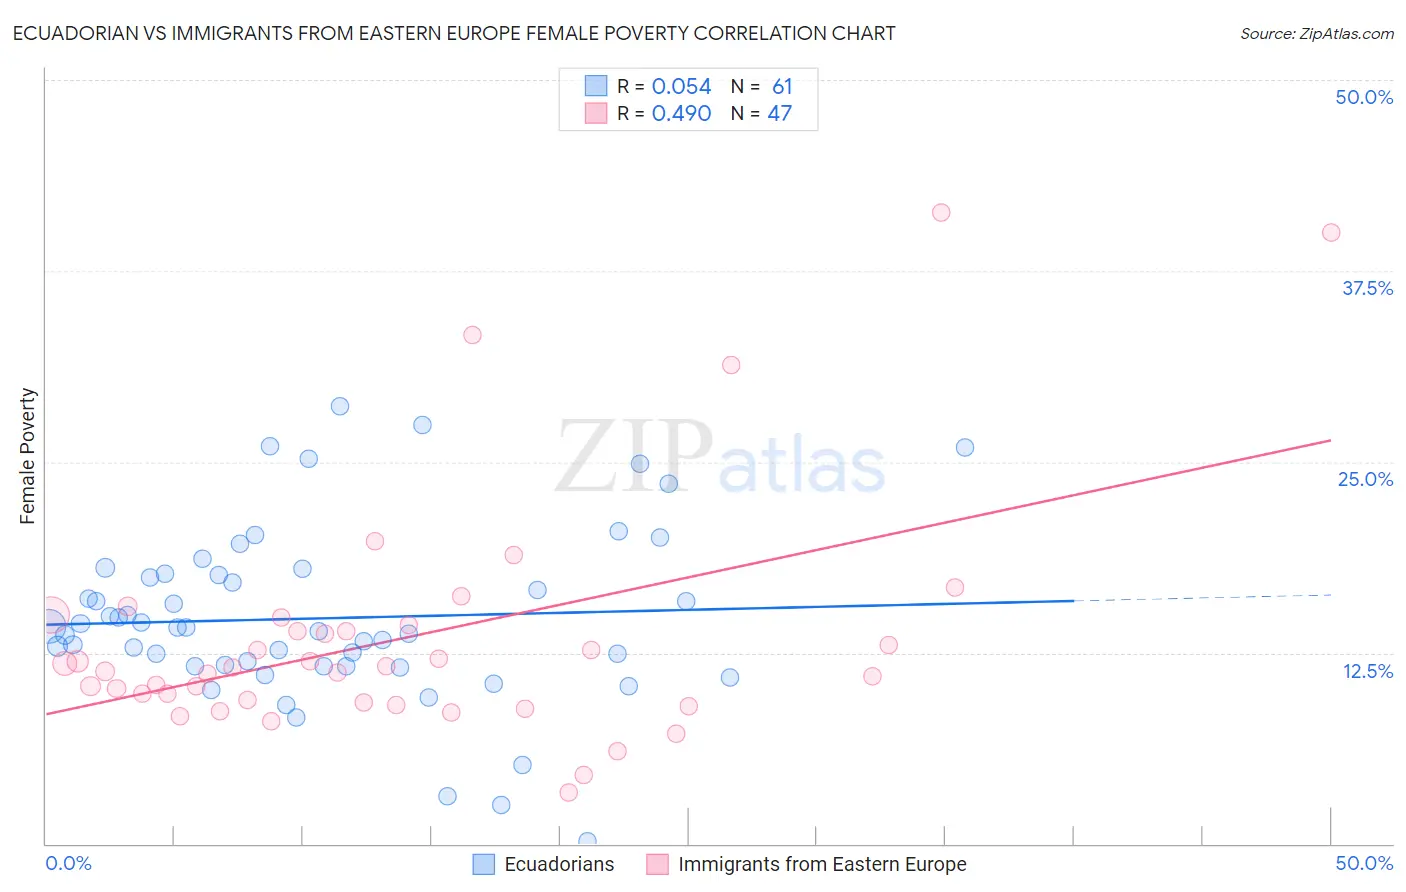
Ecuadorian vs Immigrants from Eastern Europe Female Poverty Correlation Chart

The statistical analysis conducted on geographies consisting of 317,585,196 people shows a slight positive correlation between the proportion of Ecuadorians and poverty level among females in the United States with a correlation coefficient (R) of 0.054 and weighted average of 15.3%. Similarly, the statistical analysis conducted on geographies consisting of 475,295,788 people shows a moderate positive correlation between the proportion of Immigrants from Eastern Europe and poverty level among females in the United States with a correlation coefficient (R) of 0.490 and weighted average of 12.3%, a difference of 24.3%.
Ecuadorian vs Immigrants from Eastern Europe Female Poverty

Female Poverty Correlation Summary

MeasurementEcuadorianImmigrants from Eastern Europe
Minimum0.14%3.4%
Maximum28.7%41.3%
Range28.5%37.9%
Mean14.8%13.5%
Median14.1%11.6%
Interquartile 25% (IQ1)11.7%9.3%
Interquartile 75% (IQ3)17.6%14.3%
Interquartile Range (IQR)5.9%5.0%
Standard Deviation (Sample)5.7%7.9%
Standard Deviation (Population)5.7%7.8%

Similar Demographics by Female Poverty

Demographics Similar to Ecuadorians by Female Poverty

In terms of female poverty, the demographic groups most similar to Ecuadorians are Nicaraguan (15.3%, a difference of 0.050%), Spanish American Indian (15.3%, a difference of 0.090%), Cuban (15.3%, a difference of 0.15%), Potawatomi (15.3%, a difference of 0.16%), and Immigrants from Ghana (15.3%, a difference of 0.16%).
DemographicsRating | RankFemale Poverty
French American Indians
0.6
/100
|
#237
Tragic
15.1%
Immigrants | Armenia
0.6
/100
|
#238
Tragic
15.1%
Immigrants | Middle Africa
0.5
/100
|
#239
Tragic
15.2%
Sudanese
0.5
/100
|
#240
Tragic
15.2%
Immigrants | Sudan
0.4
/100
|
#241
Tragic
15.2%
Nepalese
0.4
/100
|
#242
Tragic
15.2%
Nicaraguans
0.3
/100
|
#243
Tragic
15.3%
Ecuadorians
0.3
/100
|
#244
Tragic
15.3%
Spanish American Indians
0.3
/100
|
#245
Tragic
15.3%
Cubans
0.3
/100
|
#246
Tragic
15.3%
Potawatomi
0.3
/100
|
#247
Tragic
15.3%
Immigrants | Ghana
0.3
/100
|
#248
Tragic
15.3%
Salvadorans
0.3
/100
|
#249
Tragic
15.3%
Immigrants | Western Africa
0.3
/100
|
#250
Tragic
15.3%
Immigrants | Trinidad and Tobago
0.3
/100
|
#251
Tragic
15.4%

Demographics Similar to Immigrants from Eastern Europe by Female Poverty

In terms of female poverty, the demographic groups most similar to Immigrants from Eastern Europe are Serbian (12.3%, a difference of 0.030%), Egyptian (12.3%, a difference of 0.040%), Immigrants from North America (12.3%, a difference of 0.11%), Slovak (12.3%, a difference of 0.16%), and Immigrants from Sweden (12.3%, a difference of 0.16%).
DemographicsRating | RankFemale Poverty
Swiss
97.7
/100
|
#69
Exceptional
12.2%
Immigrants | Belgium
97.7
/100
|
#70
Exceptional
12.2%
Carpatho Rusyns
97.6
/100
|
#71
Exceptional
12.2%
Cambodians
97.5
/100
|
#72
Exceptional
12.2%
Zimbabweans
97.5
/100
|
#73
Exceptional
12.3%
Immigrants | Canada
97.5
/100
|
#74
Exceptional
12.3%
Europeans
97.4
/100
|
#75
Exceptional
12.3%
Immigrants | Eastern Europe
97.2
/100
|
#76
Exceptional
12.3%
Serbians
97.2
/100
|
#77
Exceptional
12.3%
Egyptians
97.2
/100
|
#78
Exceptional
12.3%
Immigrants | North America
97.1
/100
|
#79
Exceptional
12.3%
Slovaks
97.1
/100
|
#80
Exceptional
12.3%
Immigrants | Sweden
97.1
/100
|
#81
Exceptional
12.3%
Jordanians
97.1
/100
|
#82
Exceptional
12.3%
Immigrants | England
96.9
/100
|
#83
Exceptional
12.3%