Eastern European vs Immigrants from Eastern Asia Child Poverty Under the Age of 5

COMPARE

Eastern European
Race
Ancestry
AfghanAfricanAlaska NativeAlaskan AthabascanAlbanianAleutAlsatianAmericanApacheArabArapahoArgentineanArmenianAssyrian/Chaldean/SyriacAustralianAustrianBahamianBangladeshiBarbadianBasqueBelgianBelizeanBermudanBhutaneseBlackfeetBolivianBrazilianBritishBritish West IndianBulgarianBurmeseCajunCambodianCanadianCape VerdeanCarpatho RusynCelticCentral AmericanCentral American IndianCherokeeCheyenneChickasawChileanChineseChippewaChoctawColombianColvilleComancheCosta RicanCreeCreekCroatianCrowCubanCypriotCzechCzechoslovakianDanishDelawareDominicanDutchDutch West IndianEastern EuropeanEcuadorianEgyptianEnglishEstonianEthiopianEuropeanFijianFilipinoFinnishFrenchFrench American IndianFrench CanadianGermanGerman RussianGhanaianGreekGuamanian/ChamorroGuatemalanGuyaneseHaitianHmongHonduranHopiHoumaHungarianIcelanderIndian (Asian)IndonesianInupiatIranianIraqiIrishIroquoisIsraeliItalianJamaicanJapaneseJordanianKenyanKiowaKoreanLaotianLatvianLebaneseLiberianLithuanianLumbeeLuxembourgerMacedonianMalaysianMalteseMarshalleseMenomineeMexicanMexican American IndianMongolianMoroccanNative HawaiianNavajoNepaleseNew ZealanderNicaraguanNigerianNorthern EuropeanNorwegianOkinawanOsageOttawaPaiutePakistaniPalestinianPanamanianParaguayanPennsylvania GermanPeruvianPimaPolishPortuguesePotawatomiPuebloPuerto RicanPuget Sound SalishRomanianRussianSalvadoranSamoanScandinavianScotch-IrishScottishSeminoleSenegaleseSerbianShoshoneSierra LeoneanSiouxSlavicSlovakSloveneSomaliSouth AfricanSouth AmericanSouth American IndianSoviet UnionSpaniardSpanishSpanish AmericanSpanish American IndianSri LankanSubsaharan AfricanSudaneseSwedishSwissSyrianTaiwaneseThaiTlingit-HaidaTohono O'OdhamTonganTrinidadian and TobagonianTsimshianTurkishU.S. Virgin IslanderUgandanUkrainianUruguayanUteVenezuelanVietnameseWelshWest IndianYakamaYaquiYugoslavianYumanYup'ikZimbabwean
Immigration
NonimmigrantsImmigrantsAfghanistanAfricaAlbaniaArgentinaArmeniaAsiaAustraliaAustriaBahamasBangladeshBarbadosBelarusBelgiumBelizeBoliviaBosnia and HerzegovinaBrazilBulgariaBurma/MyanmarCabo VerdeCambodiaCameroonCanadaCaribbeanCentral AmericaChileChinaColombiaCongoCosta RicaCroatiaCubaCzechoslovakiaDenmarkDominicaDominican RepublicEastern AfricaEastern EuropeEcuadorEgyptEl SalvadorEnglandEritreaEthiopiaEuropeFijiFranceGermanyGhanaGreeceGrenadaGuatemalaGuyanaHaitiHondurasHong KongHungaryIndiaIndonesiaIranIraqIrelandIsraelItalyJamaicaJapanJordanKazakhstanKenyaKoreaKuwaitLaosLatin AmericaLatviaLebanonLiberiaLithuaniaMalaysiaMexicoMicronesiaMiddle AfricaMoldovaMoroccoNepalNetherlandsNicaraguaNigeriaNorth AmericaNorth MacedoniaNorthern AfricaNorthern EuropeNorwayOceaniaPakistanPanamaPeruPhilippinesPolandPortugalRomaniaRussiaSaudi ArabiaScotlandSenegalSerbiaSierra LeoneSingaporeSomaliaSouth AfricaSouth AmericaSouth Central AsiaSouth Eastern AsiaSouthern EuropeSpainSri LankaSt. Vincent and the GrenadinesSudanSwedenSwitzerlandSyriaTaiwanThailandTrinidad and TobagoTurkeyUgandaUkraineUruguayUzbekistanVenezuelaVietnamWest IndiesWestern AfricaWestern AsiaWestern EuropeYemenZaireZimbabweAzores
Immigrants from Eastern Asia
Race
Ancestry
AfghanAfricanAlaska NativeAlaskan AthabascanAlbanianAleutAlsatianAmericanApacheArabArapahoArgentineanArmenianAssyrian/Chaldean/SyriacAustralianAustrianBahamianBangladeshiBarbadianBasqueBelgianBelizeanBermudanBhutaneseBlackfeetBolivianBrazilianBritishBritish West IndianBulgarianBurmeseCajunCambodianCanadianCape VerdeanCarpatho RusynCelticCentral AmericanCentral American IndianCherokeeCheyenneChickasawChileanChineseChippewaChoctawColombianColvilleComancheCosta RicanCreeCreekCroatianCrowCubanCypriotCzechCzechoslovakianDanishDelawareDominicanDutchDutch West IndianEcuadorianEgyptianEnglishEstonianEthiopianEuropeanFijianFilipinoFinnishFrenchFrench American IndianFrench CanadianGermanGerman RussianGhanaianGreekGuamanian/ChamorroGuatemalanGuyaneseHaitianHmongHonduranHopiHoumaHungarianIcelanderIndian (Asian)IndonesianInupiatIranianIraqiIrishIroquoisIsraeliItalianJamaicanJapaneseJordanianKenyanKiowaKoreanLaotianLatvianLebaneseLiberianLithuanianLumbeeLuxembourgerMacedonianMalaysianMalteseMarshalleseMenomineeMexicanMexican American IndianMongolianMoroccanNative HawaiianNavajoNepaleseNew ZealanderNicaraguanNigerianNorthern EuropeanNorwegianOkinawanOsageOttawaPaiutePakistaniPalestinianPanamanianParaguayanPennsylvania GermanPeruvianPimaPolishPortuguesePotawatomiPuebloPuerto RicanPuget Sound SalishRomanianRussianSalvadoranSamoanScandinavianScotch-IrishScottishSeminoleSenegaleseSerbianShoshoneSierra LeoneanSiouxSlavicSlovakSloveneSomaliSouth AfricanSouth AmericanSouth American IndianSoviet UnionSpaniardSpanishSpanish AmericanSpanish American IndianSri LankanSubsaharan AfricanSudaneseSwedishSwissSyrianTaiwaneseThaiTlingit-HaidaTohono O'OdhamTonganTrinidadian and TobagonianTsimshianTurkishU.S. Virgin IslanderUgandanUkrainianUruguayanUteVenezuelanVietnameseWelshWest IndianYakamaYaquiYugoslavianYumanYup'ikZimbabwean
Immigration
NonimmigrantsImmigrantsAfghanistanAfricaAlbaniaArgentinaArmeniaAsiaAustraliaAustriaBahamasBangladeshBarbadosBelarusBelgiumBelizeBoliviaBosnia and HerzegovinaBrazilBulgariaBurma/MyanmarCabo VerdeCambodiaCameroonCanadaCaribbeanCentral AmericaChileChinaColombiaCongoCosta RicaCroatiaCubaCzechoslovakiaDenmarkDominicaDominican RepublicEastern AfricaEastern AsiaEastern EuropeEcuadorEgyptEl SalvadorEnglandEritreaEthiopiaEuropeFijiFranceGermanyGhanaGreeceGrenadaGuatemalaGuyanaHaitiHondurasHong KongHungaryIndiaIndonesiaIranIraqIrelandIsraelItalyJamaicaJapanJordanKazakhstanKenyaKoreaKuwaitLaosLatin AmericaLatviaLebanonLiberiaLithuaniaMalaysiaMexicoMicronesiaMiddle AfricaMoldovaMoroccoNepalNetherlandsNicaraguaNigeriaNorth AmericaNorth MacedoniaNorthern AfricaNorthern EuropeNorwayOceaniaPakistanPanamaPeruPhilippinesPolandPortugalRomaniaRussiaSaudi ArabiaScotlandSenegalSerbiaSierra LeoneSingaporeSomaliaSouth AfricaSouth AmericaSouth Central AsiaSouth Eastern AsiaSouthern EuropeSpainSri LankaSt. Vincent and the GrenadinesSudanSwedenSwitzerlandSyriaTaiwanThailandTrinidad and TobagoTurkeyUgandaUkraineUruguayUzbekistanVenezuelaVietnamWest IndiesWestern AfricaWestern AsiaWestern EuropeYemenZaireZimbabweAzores
Child Poverty Under the Age of 5
Income
Poverty
Unemployment
Labor Participation
Family Structure
Vehicle Availability
Education Level
Disability

Child Poverty Under the Age of 5 Comparison

Eastern Europeans

Immigrants from Eastern Asia

Exceptional
Exceptional
14.6%
CHILD POVERTY UNDER THE AGE OF 5
99.7/ 100
METRIC RATING
38th/ 347
METRIC RANK
13.5%
CHILD POVERTY UNDER THE AGE OF 5
100.0/ 100
METRIC RATING
16th/ 347
METRIC RANK

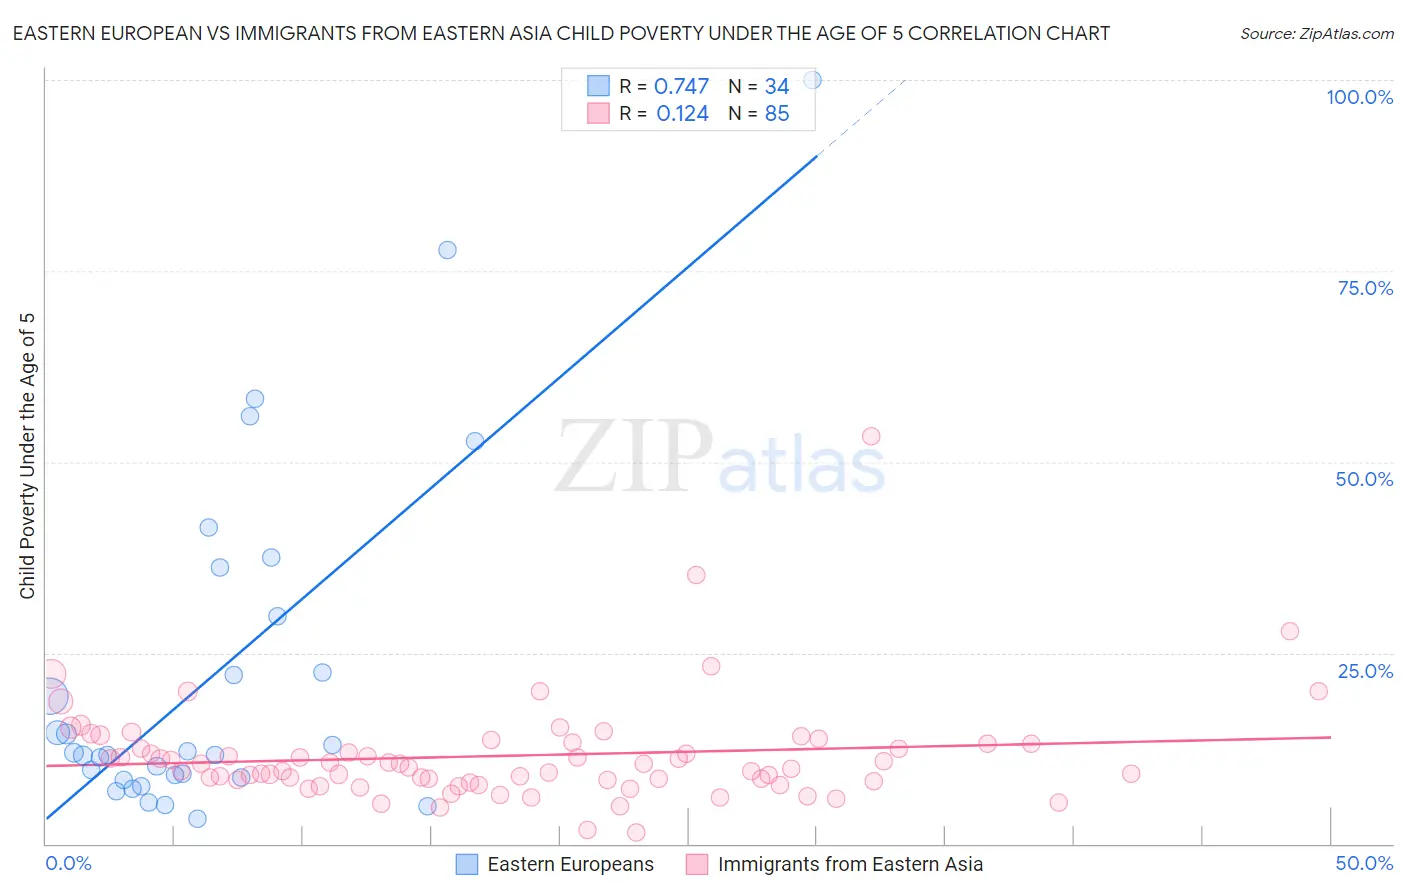
Eastern European vs Immigrants from Eastern Asia Child Poverty Under the Age of 5 Correlation Chart

The statistical analysis conducted on geographies consisting of 434,780,040 people shows a strong positive correlation between the proportion of Eastern Europeans and poverty level among children under the age of 5 in the United States with a correlation coefficient (R) of 0.747 and weighted average of 14.6%. Similarly, the statistical analysis conducted on geographies consisting of 471,993,649 people shows a poor positive correlation between the proportion of Immigrants from Eastern Asia and poverty level among children under the age of 5 in the United States with a correlation coefficient (R) of 0.124 and weighted average of 13.5%, a difference of 8.0%.
Eastern European vs Immigrants from Eastern Asia Child Poverty Under the Age of 5

Child Poverty Under the Age of 5 Correlation Summary

MeasurementEastern EuropeanImmigrants from Eastern Asia
Minimum3.2%1.4%
Maximum100.0%53.3%
Range96.8%51.9%
Mean22.4%11.5%
Median11.7%10.0%
Interquartile 25% (IQ1)8.7%8.3%
Interquartile 75% (IQ3)29.8%13.0%
Interquartile Range (IQR)21.0%4.8%
Standard Deviation (Sample)22.8%6.9%
Standard Deviation (Population)22.5%6.9%

Similar Demographics by Child Poverty Under the Age of 5

Demographics Similar to Eastern Europeans by Child Poverty Under the Age of 5

In terms of child poverty under the age of 5, the demographic groups most similar to Eastern Europeans are Norwegian (14.6%, a difference of 0.0%), Turkish (14.6%, a difference of 0.27%), Immigrants from Australia (14.6%, a difference of 0.29%), Immigrants from Belarus (14.7%, a difference of 0.41%), and Soviet Union (14.7%, a difference of 0.57%).
DemographicsRating | RankChild Poverty Under the Age of 5
Koreans
99.8
/100
|
#31
Exceptional
14.4%
Immigrants | Sri Lanka
99.8
/100
|
#32
Exceptional
14.4%
Taiwanese
99.8
/100
|
#33
Exceptional
14.5%
Immigrants | Moldova
99.8
/100
|
#34
Exceptional
14.5%
Latvians
99.8
/100
|
#35
Exceptional
14.5%
Maltese
99.8
/100
|
#36
Exceptional
14.5%
Turks
99.7
/100
|
#37
Exceptional
14.6%
Eastern Europeans
99.7
/100
|
#38
Exceptional
14.6%
Norwegians
99.7
/100
|
#39
Exceptional
14.6%
Immigrants | Australia
99.7
/100
|
#40
Exceptional
14.6%
Immigrants | Belarus
99.7
/100
|
#41
Exceptional
14.7%
Soviet Union
99.7
/100
|
#42
Exceptional
14.7%
Immigrants | Greece
99.7
/100
|
#43
Exceptional
14.7%
Immigrants | Philippines
99.7
/100
|
#44
Exceptional
14.7%
Laotians
99.6
/100
|
#45
Exceptional
14.7%

Demographics Similar to Immigrants from Eastern Asia by Child Poverty Under the Age of 5

In terms of child poverty under the age of 5, the demographic groups most similar to Immigrants from Eastern Asia are Assyrian/Chaldean/Syriac (13.6%, a difference of 0.34%), Indian (Asian) (13.4%, a difference of 0.51%), Okinawan (13.4%, a difference of 0.57%), Immigrants from China (13.6%, a difference of 0.63%), and Bhutanese (13.4%, a difference of 1.2%).
DemographicsRating | RankChild Poverty Under the Age of 5
Immigrants | Iran
100.0
/100
|
#9
Exceptional
13.1%
Burmese
100.0
/100
|
#10
Exceptional
13.2%
Immigrants | Korea
100.0
/100
|
#11
Exceptional
13.2%
Immigrants | South Central Asia
100.0
/100
|
#12
Exceptional
13.3%
Bhutanese
100.0
/100
|
#13
Exceptional
13.4%
Okinawans
100.0
/100
|
#14
Exceptional
13.4%
Indians (Asian)
100.0
/100
|
#15
Exceptional
13.4%
Immigrants | Eastern Asia
100.0
/100
|
#16
Exceptional
13.5%
Assyrians/Chaldeans/Syriacs
100.0
/100
|
#17
Exceptional
13.6%
Immigrants | China
100.0
/100
|
#18
Exceptional
13.6%
Immigrants | Ireland
100.0
/100
|
#19
Exceptional
13.7%
Immigrants | Japan
100.0
/100
|
#20
Exceptional
13.8%
Bolivians
100.0
/100
|
#21
Exceptional
13.8%
Immigrants | Bolivia
100.0
/100
|
#22
Exceptional
13.8%
Bulgarians
99.9
/100
|
#23
Exceptional
13.9%