Dutch West Indian vs Israeli Female Poverty
COMPARE
Dutch West Indian
Israeli
Female Poverty
Female Poverty Comparison
Dutch West Indians
Israelis
17.1%
FEMALE POVERTY
0.0/ 100
METRIC RATING
314th/ 347
METRIC RANK
13.5%
FEMALE POVERTY
49.1/ 100
METRIC RATING
178th/ 347
METRIC RANK
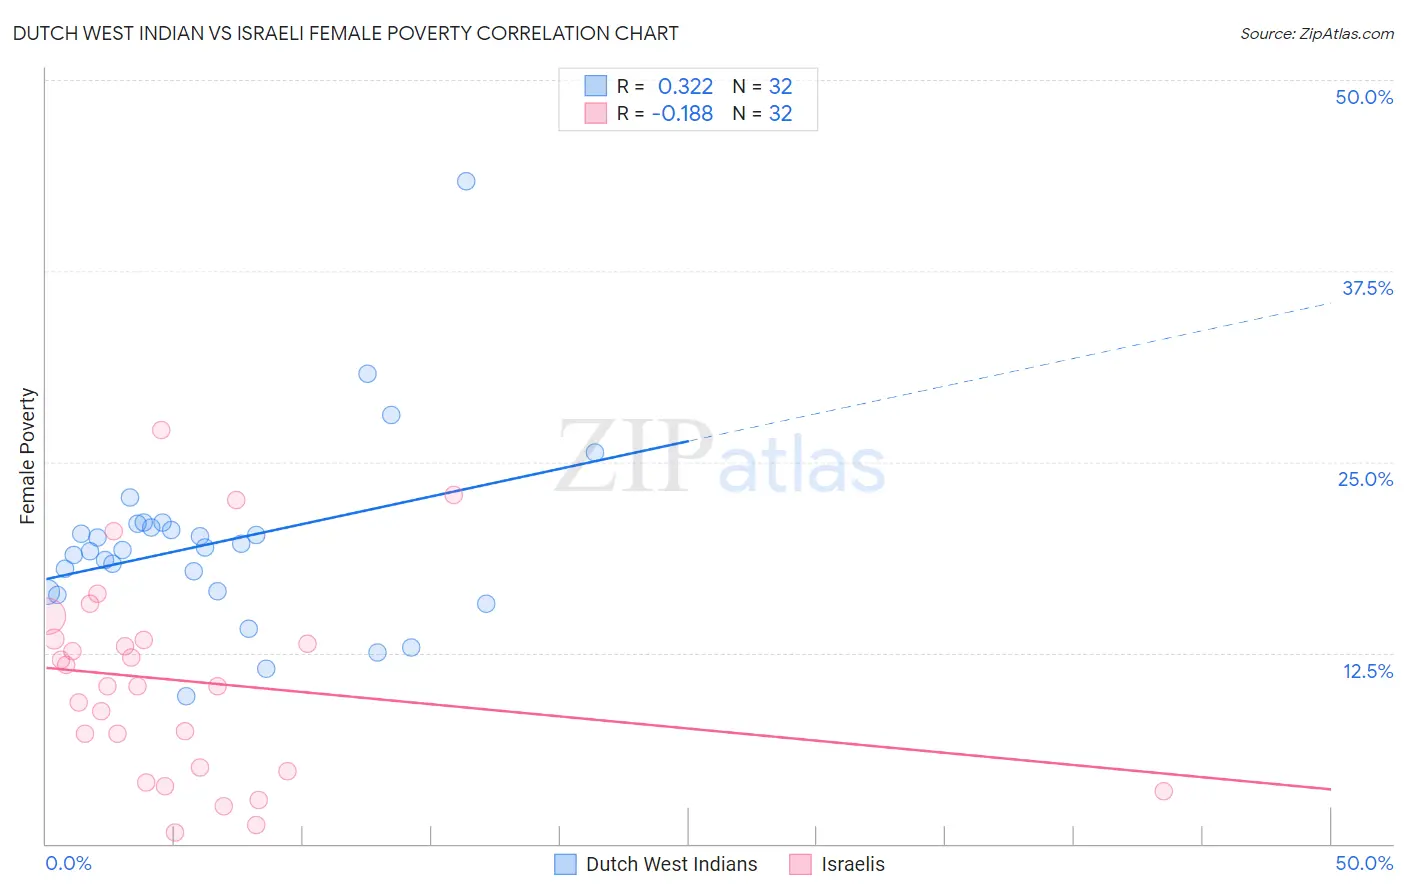
Dutch West Indian vs Israeli Female Poverty Correlation Chart
The statistical analysis conducted on geographies consisting of 85,761,145 people shows a mild positive correlation between the proportion of Dutch West Indians and poverty level among females in the United States with a correlation coefficient (R) of 0.322 and weighted average of 17.1%. Similarly, the statistical analysis conducted on geographies consisting of 211,005,124 people shows a poor negative correlation between the proportion of Israelis and poverty level among females in the United States with a correlation coefficient (R) of -0.188 and weighted average of 13.5%, a difference of 26.9%.
Female Poverty Correlation Summary
| Measurement | Dutch West Indian | Israeli |
| Minimum | 9.6% | 0.76% |
| Maximum | 43.3% | 27.1% |
| Range | 33.7% | 26.4% |
| Mean | 19.7% | 10.6% |
| Median | 19.3% | 10.3% |
| Interquartile 25% (IQ1) | 16.5% | 4.9% |
| Interquartile 75% (IQ3) | 20.8% | 13.4% |
| Interquartile Range (IQR) | 4.3% | 8.5% |
| Standard Deviation (Sample) | 6.1% | 6.6% |
| Standard Deviation (Population) | 6.0% | 6.5% |
Similar Demographics by Female Poverty
Demographics Similar to Dutch West Indians by Female Poverty
In terms of female poverty, the demographic groups most similar to Dutch West Indians are British West Indian (17.0%, a difference of 0.25%), Immigrants from Somalia (17.0%, a difference of 0.33%), Creek (17.0%, a difference of 0.42%), Immigrants from Guatemala (17.0%, a difference of 0.42%), and Immigrants from Mexico (17.0%, a difference of 0.67%).
| Demographics | Rating | Rank | Female Poverty |
| Seminole | 0.0 /100 | #307 | Tragic 16.9% |
| Africans | 0.0 /100 | #308 | Tragic 16.9% |
| Immigrants | Mexico | 0.0 /100 | #309 | Tragic 17.0% |
| Creek | 0.0 /100 | #310 | Tragic 17.0% |
| Immigrants | Guatemala | 0.0 /100 | #311 | Tragic 17.0% |
| Immigrants | Somalia | 0.0 /100 | #312 | Tragic 17.0% |
| British West Indians | 0.0 /100 | #313 | Tragic 17.0% |
| Dutch West Indians | 0.0 /100 | #314 | Tragic 17.1% |
| U.S. Virgin Islanders | 0.0 /100 | #315 | Tragic 17.3% |
| Hondurans | 0.0 /100 | #316 | Tragic 17.4% |
| Immigrants | Congo | 0.0 /100 | #317 | Tragic 17.4% |
| Ute | 0.0 /100 | #318 | Tragic 17.5% |
| Cajuns | 0.0 /100 | #319 | Tragic 17.5% |
| Immigrants | Dominica | 0.0 /100 | #320 | Tragic 17.5% |
| Arapaho | 0.0 /100 | #321 | Tragic 17.5% |
Demographics Similar to Israelis by Female Poverty
In terms of female poverty, the demographic groups most similar to Israelis are Immigrants from Morocco (13.4%, a difference of 0.030%), Immigrants from Syria (13.5%, a difference of 0.030%), Celtic (13.4%, a difference of 0.080%), Immigrants from Spain (13.4%, a difference of 0.080%), and Immigrants from Iraq (13.4%, a difference of 0.090%).
| Demographics | Rating | Rank | Female Poverty |
| Whites/Caucasians | 54.6 /100 | #171 | Average 13.4% |
| Mongolians | 53.6 /100 | #172 | Average 13.4% |
| Immigrants | Afghanistan | 50.8 /100 | #173 | Average 13.4% |
| Immigrants | Iraq | 50.0 /100 | #174 | Average 13.4% |
| Celtics | 49.9 /100 | #175 | Average 13.4% |
| Immigrants | Spain | 49.9 /100 | #176 | Average 13.4% |
| Immigrants | Morocco | 49.4 /100 | #177 | Average 13.4% |
| Israelis | 49.1 /100 | #178 | Average 13.5% |
| Immigrants | Syria | 48.8 /100 | #179 | Average 13.5% |
| South Americans | 44.8 /100 | #180 | Average 13.5% |
| Venezuelans | 44.5 /100 | #181 | Average 13.5% |
| Immigrants | Colombia | 44.5 /100 | #182 | Average 13.5% |
| Kenyans | 43.8 /100 | #183 | Average 13.5% |
| Immigrants | Sierra Leone | 43.2 /100 | #184 | Average 13.5% |
| Immigrants | Cameroon | 42.0 /100 | #185 | Average 13.5% |