Dutch West Indian vs Guatemalan Single Father Poverty
COMPARE
Dutch West Indian
Guatemalan
Single Father Poverty
Single Father Poverty Comparison
Dutch West Indians
Guatemalans
19.2%
SINGLE FATHER POVERTY
0.0/ 100
METRIC RATING
318th/ 347
METRIC RANK
16.6%
SINGLE FATHER POVERTY
12.9/ 100
METRIC RATING
210th/ 347
METRIC RANK
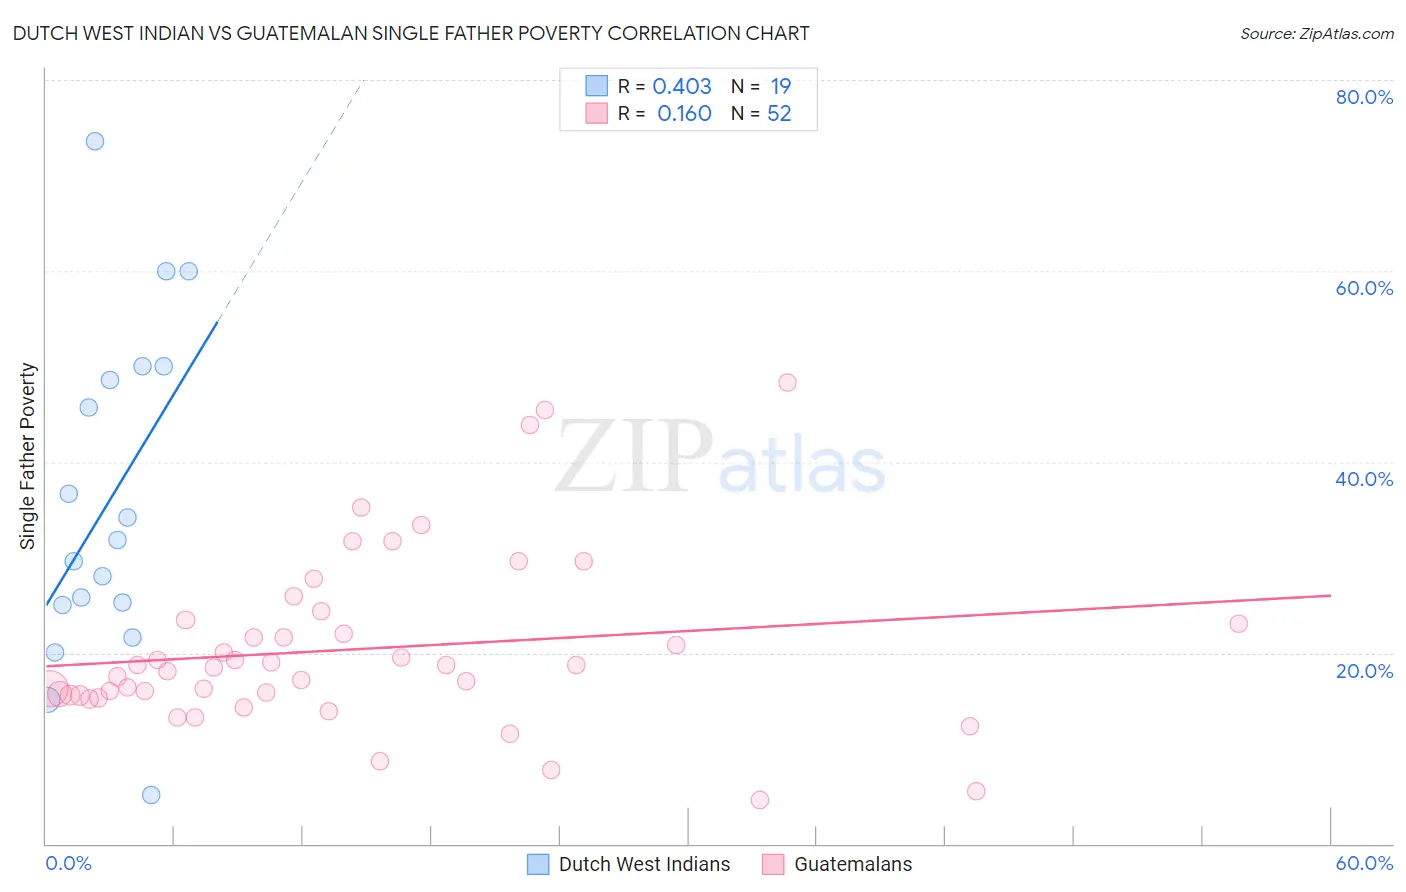
Dutch West Indian vs Guatemalan Single Father Poverty Correlation Chart
The statistical analysis conducted on geographies consisting of 78,591,336 people shows a moderate positive correlation between the proportion of Dutch West Indians and poverty level among single fathers in the United States with a correlation coefficient (R) of 0.403 and weighted average of 19.2%. Similarly, the statistical analysis conducted on geographies consisting of 326,782,810 people shows a poor positive correlation between the proportion of Guatemalans and poverty level among single fathers in the United States with a correlation coefficient (R) of 0.160 and weighted average of 16.6%, a difference of 15.4%.
Single Father Poverty Correlation Summary
| Measurement | Dutch West Indian | Guatemalan |
| Minimum | 5.2% | 4.6% |
| Maximum | 73.5% | 48.3% |
| Range | 68.4% | 43.7% |
| Mean | 36.1% | 20.4% |
| Median | 31.8% | 18.6% |
| Interquartile 25% (IQ1) | 25.0% | 15.5% |
| Interquartile 75% (IQ3) | 50.0% | 23.2% |
| Interquartile Range (IQR) | 25.0% | 7.7% |
| Standard Deviation (Sample) | 17.5% | 9.1% |
| Standard Deviation (Population) | 17.1% | 9.1% |
Similar Demographics by Single Father Poverty
Demographics Similar to Dutch West Indians by Single Father Poverty
In terms of single father poverty, the demographic groups most similar to Dutch West Indians are Slovak (19.3%, a difference of 0.52%), Dominican (19.1%, a difference of 0.58%), Osage (19.0%, a difference of 0.89%), Chickasaw (19.0%, a difference of 1.3%), and Inupiat (19.5%, a difference of 1.4%).
| Demographics | Rating | Rank | Single Father Poverty |
| Immigrants | Nonimmigrants | 0.0 /100 | #311 | Tragic 18.8% |
| Immigrants | Dominica | 0.0 /100 | #312 | Tragic 18.9% |
| Potawatomi | 0.0 /100 | #313 | Tragic 18.9% |
| Delaware | 0.0 /100 | #314 | Tragic 18.9% |
| Chickasaw | 0.0 /100 | #315 | Tragic 19.0% |
| Osage | 0.0 /100 | #316 | Tragic 19.0% |
| Dominicans | 0.0 /100 | #317 | Tragic 19.1% |
| Dutch West Indians | 0.0 /100 | #318 | Tragic 19.2% |
| Slovaks | 0.0 /100 | #319 | Tragic 19.3% |
| Inupiat | 0.0 /100 | #320 | Tragic 19.5% |
| Cherokee | 0.0 /100 | #321 | Tragic 19.6% |
| Creek | 0.0 /100 | #322 | Tragic 19.8% |
| Pennsylvania Germans | 0.0 /100 | #323 | Tragic 20.0% |
| Americans | 0.0 /100 | #324 | Tragic 20.1% |
| Blacks/African Americans | 0.0 /100 | #325 | Tragic 20.4% |
Demographics Similar to Guatemalans by Single Father Poverty
In terms of single father poverty, the demographic groups most similar to Guatemalans are Arab (16.6%, a difference of 0.0%), European (16.6%, a difference of 0.030%), New Zealander (16.6%, a difference of 0.070%), Eastern European (16.6%, a difference of 0.070%), and Immigrants from Senegal (16.6%, a difference of 0.080%).
| Demographics | Rating | Rank | Single Father Poverty |
| Immigrants | North America | 15.1 /100 | #203 | Poor 16.6% |
| Immigrants | Guatemala | 14.8 /100 | #204 | Poor 16.6% |
| Venezuelans | 14.3 /100 | #205 | Poor 16.6% |
| Immigrants | Senegal | 13.7 /100 | #206 | Poor 16.6% |
| New Zealanders | 13.7 /100 | #207 | Poor 16.6% |
| Eastern Europeans | 13.7 /100 | #208 | Poor 16.6% |
| Europeans | 13.2 /100 | #209 | Poor 16.6% |
| Guatemalans | 12.9 /100 | #210 | Poor 16.6% |
| Arabs | 12.8 /100 | #211 | Poor 16.6% |
| Immigrants | Southern Europe | 11.2 /100 | #212 | Poor 16.7% |
| Ghanaians | 11.0 /100 | #213 | Poor 16.7% |
| Spanish | 10.7 /100 | #214 | Poor 16.7% |
| Immigrants | Scotland | 9.6 /100 | #215 | Tragic 16.7% |
| Immigrants | England | 9.5 /100 | #216 | Tragic 16.7% |
| Cheyenne | 9.3 /100 | #217 | Tragic 16.7% |