Dominican vs Spanish American Single Female Poverty
COMPARE
Dominican
Spanish American
Single Female Poverty
Single Female Poverty Comparison
Dominicans
Spanish Americans
25.4%
SINGLE FEMALE POVERTY
0.0/ 100
METRIC RATING
309th/ 347
METRIC RANK
24.2%
SINGLE FEMALE POVERTY
0.0/ 100
METRIC RATING
288th/ 347
METRIC RANK
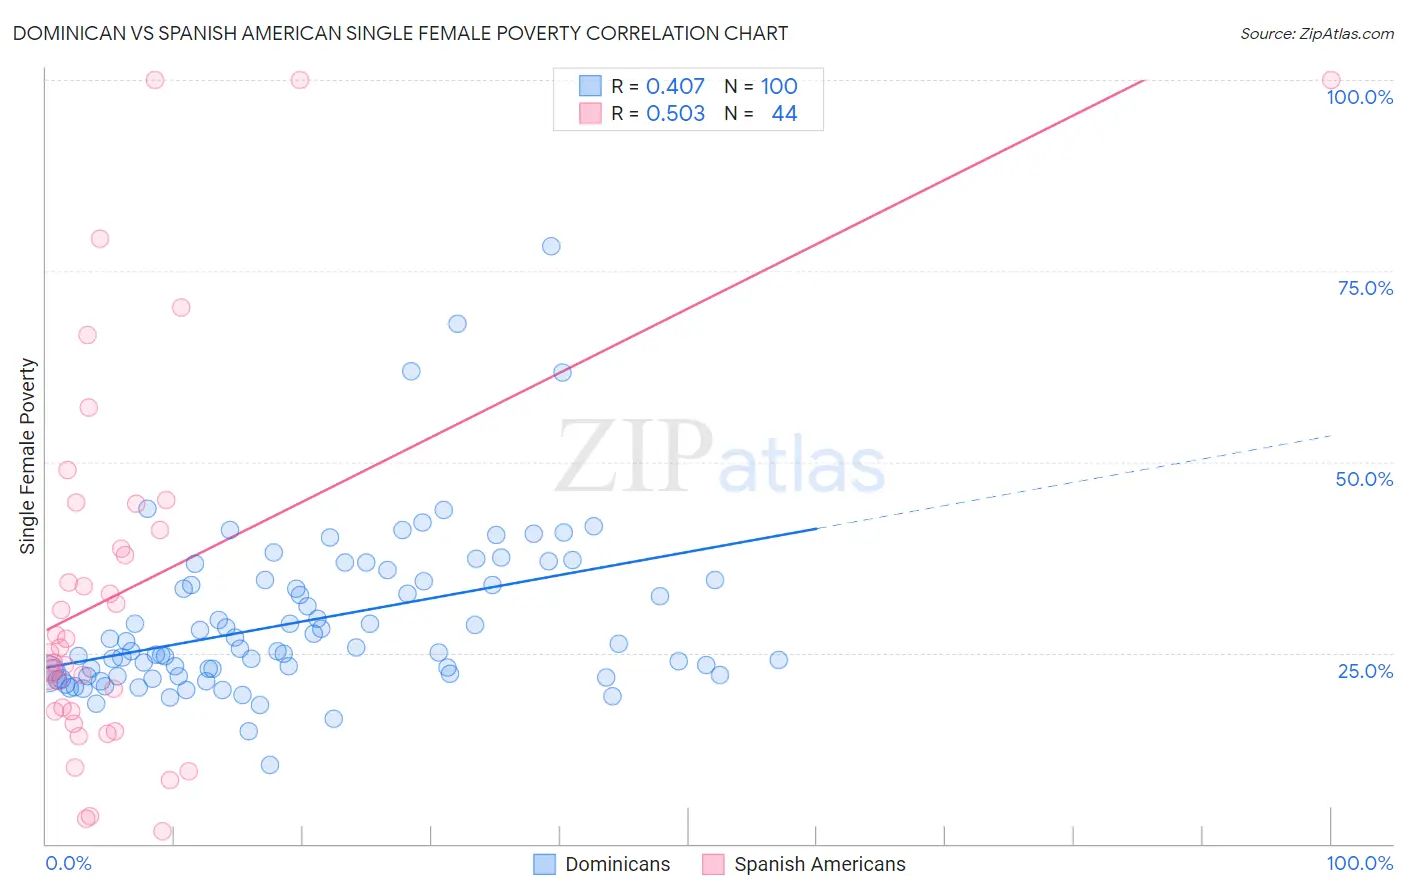
Dominican vs Spanish American Single Female Poverty Correlation Chart
The statistical analysis conducted on geographies consisting of 349,852,578 people shows a moderate positive correlation between the proportion of Dominicans and poverty level among single females in the United States with a correlation coefficient (R) of 0.407 and weighted average of 25.4%. Similarly, the statistical analysis conducted on geographies consisting of 102,906,499 people shows a substantial positive correlation between the proportion of Spanish Americans and poverty level among single females in the United States with a correlation coefficient (R) of 0.503 and weighted average of 24.2%, a difference of 5.2%.
Single Female Poverty Correlation Summary
| Measurement | Dominican | Spanish American |
| Minimum | 10.3% | 1.6% |
| Maximum | 78.2% | 100.0% |
| Range | 67.9% | 98.4% |
| Mean | 29.2% | 33.3% |
| Median | 25.3% | 25.4% |
| Interquartile 25% (IQ1) | 22.1% | 17.4% |
| Interquartile 75% (IQ3) | 34.4% | 42.8% |
| Interquartile Range (IQR) | 12.4% | 25.4% |
| Standard Deviation (Sample) | 10.8% | 25.1% |
| Standard Deviation (Population) | 10.7% | 24.8% |
Similar Demographics by Single Female Poverty
Demographics Similar to Dominicans by Single Female Poverty
In terms of single female poverty, the demographic groups most similar to Dominicans are Aleut (25.4%, a difference of 0.010%), Central American Indian (25.5%, a difference of 0.15%), Potawatomi (25.4%, a difference of 0.18%), Immigrants from Mexico (25.3%, a difference of 0.41%), and Immigrants from Honduras (25.5%, a difference of 0.43%).
| Demographics | Rating | Rank | Single Female Poverty |
| Shoshone | 0.0 /100 | #302 | Tragic 25.1% |
| Somalis | 0.0 /100 | #303 | Tragic 25.2% |
| Immigrants | Congo | 0.0 /100 | #304 | Tragic 25.3% |
| Immigrants | Dominican Republic | 0.0 /100 | #305 | Tragic 25.3% |
| Immigrants | Mexico | 0.0 /100 | #306 | Tragic 25.3% |
| Potawatomi | 0.0 /100 | #307 | Tragic 25.4% |
| Aleuts | 0.0 /100 | #308 | Tragic 25.4% |
| Dominicans | 0.0 /100 | #309 | Tragic 25.4% |
| Central American Indians | 0.0 /100 | #310 | Tragic 25.5% |
| Immigrants | Honduras | 0.0 /100 | #311 | Tragic 25.5% |
| Paiute | 0.0 /100 | #312 | Tragic 25.5% |
| Comanche | 0.0 /100 | #313 | Tragic 25.6% |
| Cherokee | 0.0 /100 | #314 | Tragic 25.7% |
| Iroquois | 0.0 /100 | #315 | Tragic 25.7% |
| Immigrants | Somalia | 0.0 /100 | #316 | Tragic 25.8% |
Demographics Similar to Spanish Americans by Single Female Poverty
In terms of single female poverty, the demographic groups most similar to Spanish Americans are Bangladeshi (24.2%, a difference of 0.020%), U.S. Virgin Islander (24.2%, a difference of 0.050%), Cree (24.1%, a difference of 0.17%), Immigrants from Guatemala (24.1%, a difference of 0.21%), and Indonesian (24.3%, a difference of 0.40%).
| Demographics | Rating | Rank | Single Female Poverty |
| Immigrants | Zaire | 0.0 /100 | #281 | Tragic 23.8% |
| Guatemalans | 0.0 /100 | #282 | Tragic 23.8% |
| German Russians | 0.0 /100 | #283 | Tragic 23.9% |
| Immigrants | Dominica | 0.0 /100 | #284 | Tragic 23.9% |
| Immigrants | Guatemala | 0.0 /100 | #285 | Tragic 24.1% |
| Cree | 0.0 /100 | #286 | Tragic 24.1% |
| Bangladeshis | 0.0 /100 | #287 | Tragic 24.2% |
| Spanish Americans | 0.0 /100 | #288 | Tragic 24.2% |
| U.S. Virgin Islanders | 0.0 /100 | #289 | Tragic 24.2% |
| Indonesians | 0.0 /100 | #290 | Tragic 24.3% |
| Osage | 0.0 /100 | #291 | Tragic 24.4% |
| Alsatians | 0.0 /100 | #292 | Tragic 24.5% |
| Americans | 0.0 /100 | #293 | Tragic 24.5% |
| French American Indians | 0.0 /100 | #294 | Tragic 24.6% |
| Hispanics or Latinos | 0.0 /100 | #295 | Tragic 24.6% |