Dominican vs Peruvian Single Male Poverty
COMPARE
Dominican
Peruvian
Single Male Poverty
Single Male Poverty Comparison
Dominicans
Peruvians
15.2%
SINGLE MALE POVERTY
0.0/ 100
METRIC RATING
301st/ 347
METRIC RANK
11.8%
SINGLE MALE POVERTY
99.8/ 100
METRIC RATING
60th/ 347
METRIC RANK
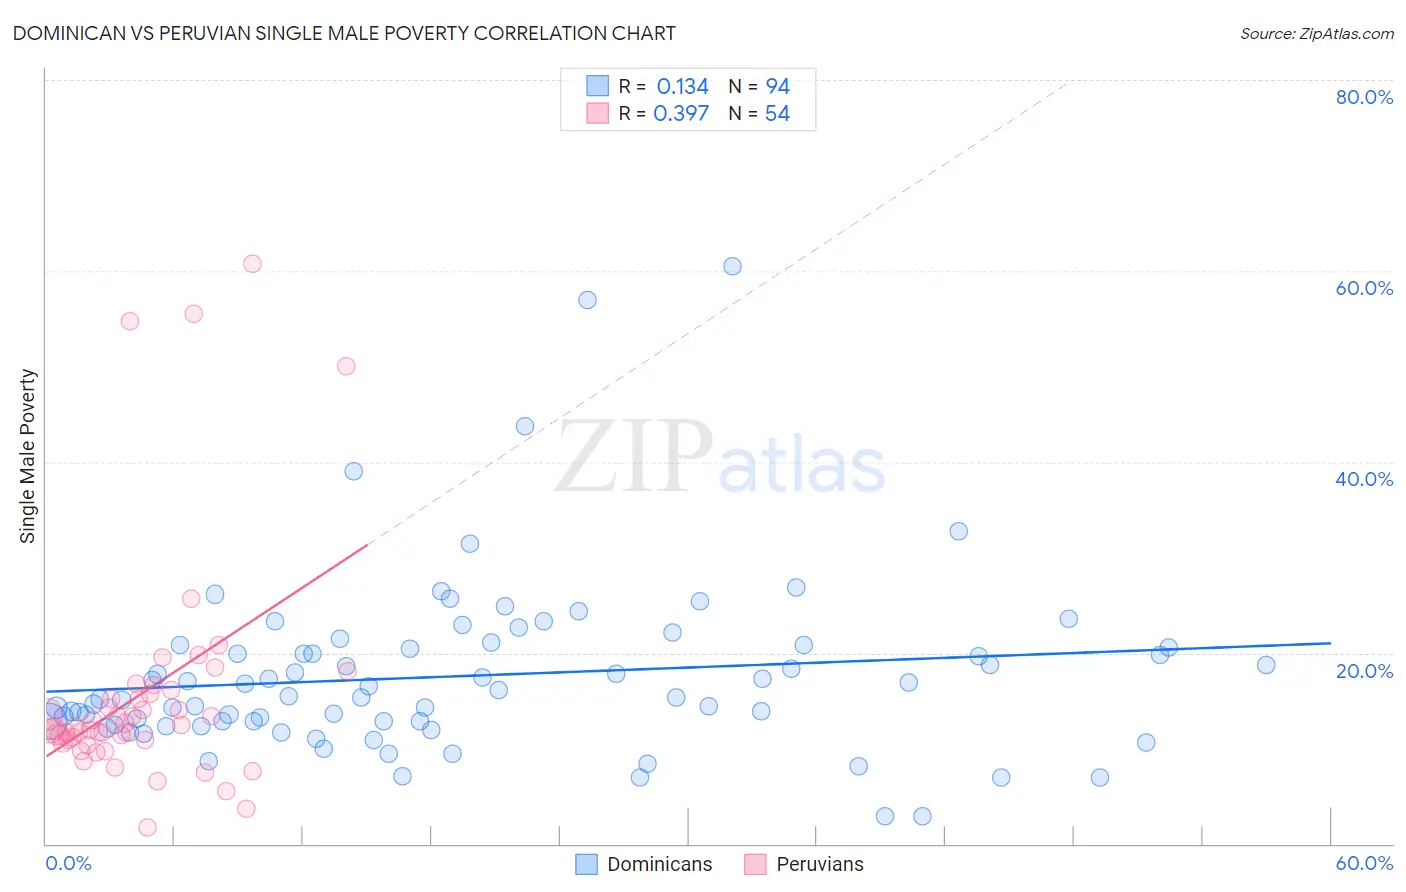
Dominican vs Peruvian Single Male Poverty Correlation Chart
The statistical analysis conducted on geographies consisting of 318,233,165 people shows a poor positive correlation between the proportion of Dominicans and poverty level among single males in the United States with a correlation coefficient (R) of 0.134 and weighted average of 15.2%. Similarly, the statistical analysis conducted on geographies consisting of 326,481,306 people shows a mild positive correlation between the proportion of Peruvians and poverty level among single males in the United States with a correlation coefficient (R) of 0.397 and weighted average of 11.8%, a difference of 29.2%.
Single Male Poverty Correlation Summary
| Measurement | Dominican | Peruvian |
| Minimum | 2.9% | 1.7% |
| Maximum | 60.5% | 60.7% |
| Range | 57.6% | 59.0% |
| Mean | 17.6% | 15.6% |
| Median | 15.4% | 12.1% |
| Interquartile 25% (IQ1) | 12.8% | 10.9% |
| Interquartile 75% (IQ3) | 20.6% | 15.7% |
| Interquartile Range (IQR) | 7.8% | 4.8% |
| Standard Deviation (Sample) | 9.1% | 12.1% |
| Standard Deviation (Population) | 9.1% | 12.0% |
Similar Demographics by Single Male Poverty
Demographics Similar to Dominicans by Single Male Poverty
In terms of single male poverty, the demographic groups most similar to Dominicans are Alsatian (15.2%, a difference of 0.16%), Cree (15.1%, a difference of 0.82%), Aleut (15.4%, a difference of 1.2%), Delaware (15.0%, a difference of 1.3%), and Alaska Native (15.4%, a difference of 1.3%).
| Demographics | Rating | Rank | Single Male Poverty |
| Ottawa | 0.0 /100 | #294 | Tragic 14.6% |
| Scotch-Irish | 0.0 /100 | #295 | Tragic 14.7% |
| Africans | 0.0 /100 | #296 | Tragic 14.7% |
| Immigrants | Dominican Republic | 0.0 /100 | #297 | Tragic 14.8% |
| French American Indians | 0.0 /100 | #298 | Tragic 15.0% |
| Delaware | 0.0 /100 | #299 | Tragic 15.0% |
| Cree | 0.0 /100 | #300 | Tragic 15.1% |
| Dominicans | 0.0 /100 | #301 | Tragic 15.2% |
| Alsatians | 0.0 /100 | #302 | Tragic 15.2% |
| Aleuts | 0.0 /100 | #303 | Tragic 15.4% |
| Alaska Natives | 0.0 /100 | #304 | Tragic 15.4% |
| Blackfeet | 0.0 /100 | #305 | Tragic 15.5% |
| Pennsylvania Germans | 0.0 /100 | #306 | Tragic 15.6% |
| Ute | 0.0 /100 | #307 | Tragic 15.7% |
| Potawatomi | 0.0 /100 | #308 | Tragic 15.8% |
Demographics Similar to Peruvians by Single Male Poverty
In terms of single male poverty, the demographic groups most similar to Peruvians are Cambodian (11.8%, a difference of 0.020%), Brazilian (11.8%, a difference of 0.21%), Immigrants from Brazil (11.7%, a difference of 0.29%), Immigrants from Romania (11.7%, a difference of 0.32%), and Immigrants from Sri Lanka (11.8%, a difference of 0.40%).
| Demographics | Rating | Rank | Single Male Poverty |
| Bulgarians | 99.9 /100 | #53 | Exceptional 11.7% |
| Immigrants | Uzbekistan | 99.9 /100 | #54 | Exceptional 11.7% |
| Cypriots | 99.9 /100 | #55 | Exceptional 11.7% |
| Burmese | 99.8 /100 | #56 | Exceptional 11.7% |
| Immigrants | Romania | 99.8 /100 | #57 | Exceptional 11.7% |
| Immigrants | Brazil | 99.8 /100 | #58 | Exceptional 11.7% |
| Brazilians | 99.8 /100 | #59 | Exceptional 11.8% |
| Peruvians | 99.8 /100 | #60 | Exceptional 11.8% |
| Cambodians | 99.8 /100 | #61 | Exceptional 11.8% |
| Immigrants | Sri Lanka | 99.7 /100 | #62 | Exceptional 11.8% |
| Immigrants | Belarus | 99.7 /100 | #63 | Exceptional 11.8% |
| Immigrants | Eastern Europe | 99.6 /100 | #64 | Exceptional 11.8% |
| Laotians | 99.6 /100 | #65 | Exceptional 11.9% |
| Immigrants | Uruguay | 99.6 /100 | #66 | Exceptional 11.9% |
| Immigrants | Ukraine | 99.6 /100 | #67 | Exceptional 11.9% |