Delaware vs Pakistani Poverty
COMPARE
Delaware
Pakistani
Poverty
Poverty Comparison
Delaware
Pakistanis
12.7%
POVERTY
21.4/ 100
METRIC RATING
193rd/ 347
METRIC RANK
11.9%
POVERTY
82.2/ 100
METRIC RATING
139th/ 347
METRIC RANK
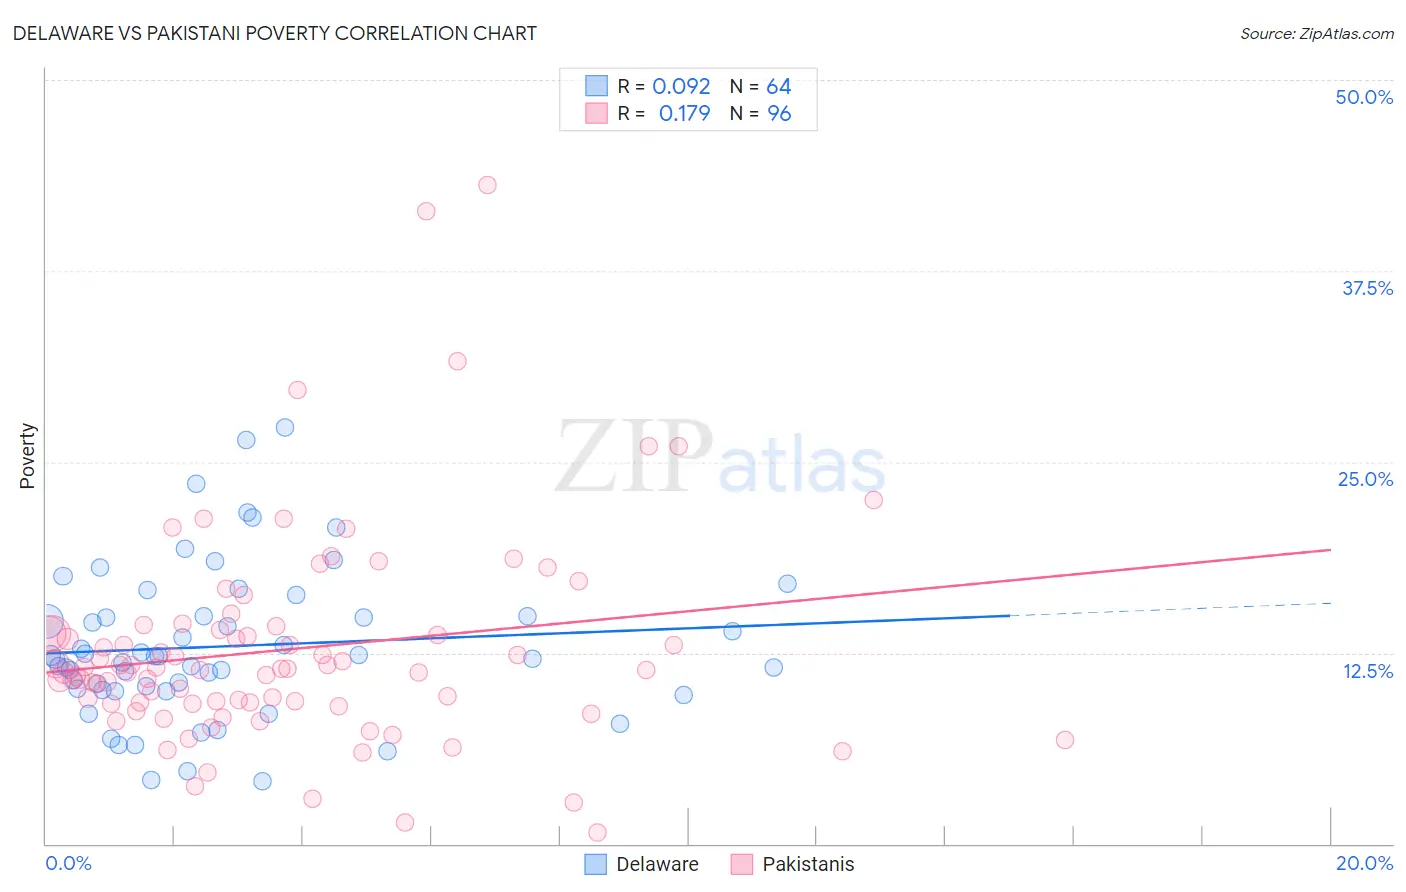
Delaware vs Pakistani Poverty Correlation Chart
The statistical analysis conducted on geographies consisting of 96,223,629 people shows a slight positive correlation between the proportion of Delaware and poverty level in the United States with a correlation coefficient (R) of 0.092 and weighted average of 12.7%. Similarly, the statistical analysis conducted on geographies consisting of 335,215,631 people shows a poor positive correlation between the proportion of Pakistanis and poverty level in the United States with a correlation coefficient (R) of 0.179 and weighted average of 11.9%, a difference of 7.1%.
Poverty Correlation Summary
| Measurement | Delaware | Pakistani |
| Minimum | 4.1% | 0.75% |
| Maximum | 27.2% | 43.1% |
| Range | 23.2% | 42.4% |
| Mean | 12.9% | 12.7% |
| Median | 12.2% | 11.4% |
| Interquartile 25% (IQ1) | 10.1% | 9.2% |
| Interquartile 75% (IQ3) | 14.9% | 13.9% |
| Interquartile Range (IQR) | 4.8% | 4.7% |
| Standard Deviation (Sample) | 5.0% | 7.0% |
| Standard Deviation (Population) | 4.9% | 6.9% |
Similar Demographics by Poverty
Demographics Similar to Delaware by Poverty
In terms of poverty, the demographic groups most similar to Delaware are Arab (12.7%, a difference of 0.040%), Immigrants from Kuwait (12.7%, a difference of 0.080%), Iraqi (12.7%, a difference of 0.090%), South American Indian (12.7%, a difference of 0.25%), and Immigrants from Lebanon (12.8%, a difference of 0.40%).
| Demographics | Rating | Rank | Poverty |
| Immigrants | Sierra Leone | 36.3 /100 | #186 | Fair 12.5% |
| Hawaiians | 34.1 /100 | #187 | Fair 12.5% |
| Immigrants | Costa Rica | 33.3 /100 | #188 | Fair 12.5% |
| Aleuts | 33.2 /100 | #189 | Fair 12.5% |
| Immigrants | South America | 32.3 /100 | #190 | Fair 12.5% |
| Sierra Leoneans | 31.5 /100 | #191 | Fair 12.6% |
| South American Indians | 23.3 /100 | #192 | Fair 12.7% |
| Delaware | 21.4 /100 | #193 | Fair 12.7% |
| Arabs | 21.1 /100 | #194 | Fair 12.7% |
| Immigrants | Kuwait | 20.9 /100 | #195 | Fair 12.7% |
| Iraqis | 20.8 /100 | #196 | Fair 12.7% |
| Immigrants | Lebanon | 18.7 /100 | #197 | Poor 12.8% |
| Spanish | 18.7 /100 | #198 | Poor 12.8% |
| Immigrants | Kenya | 17.5 /100 | #199 | Poor 12.8% |
| Spaniards | 16.5 /100 | #200 | Poor 12.8% |
Demographics Similar to Pakistanis by Poverty
In terms of poverty, the demographic groups most similar to Pakistanis are Immigrants from Jordan (11.9%, a difference of 0.030%), Immigrants from Switzerland (11.8%, a difference of 0.14%), Immigrants from Peru (11.9%, a difference of 0.19%), Immigrants from France (11.9%, a difference of 0.28%), and Basque (11.9%, a difference of 0.30%).
| Demographics | Rating | Rank | Poverty |
| Peruvians | 85.6 /100 | #132 | Excellent 11.8% |
| Immigrants | Western Europe | 85.2 /100 | #133 | Excellent 11.8% |
| Yugoslavians | 85.2 /100 | #134 | Excellent 11.8% |
| Immigrants | Vietnam | 85.2 /100 | #135 | Excellent 11.8% |
| Chileans | 84.2 /100 | #136 | Excellent 11.8% |
| Immigrants | Switzerland | 83.0 /100 | #137 | Excellent 11.8% |
| Immigrants | Jordan | 82.4 /100 | #138 | Excellent 11.9% |
| Pakistanis | 82.2 /100 | #139 | Excellent 11.9% |
| Immigrants | Peru | 81.1 /100 | #140 | Excellent 11.9% |
| Immigrants | France | 80.5 /100 | #141 | Excellent 11.9% |
| Basques | 80.4 /100 | #142 | Excellent 11.9% |
| Brazilians | 79.7 /100 | #143 | Good 11.9% |
| Icelanders | 77.9 /100 | #144 | Good 11.9% |
| Syrians | 75.1 /100 | #145 | Good 12.0% |
| Afghans | 74.9 /100 | #146 | Good 12.0% |