Danish vs Celtic Child Poverty Under the Age of 16
COMPARE
Danish
Celtic
Child Poverty Under the Age of 16
Child Poverty Under the Age of 16 Comparison
Danes
Celtics
13.4%
CHILD POVERTY UNDER THE AGE OF 16
99.7/ 100
METRIC RATING
31st/ 347
METRIC RANK
16.4%
CHILD POVERTY UNDER THE AGE OF 16
38.2/ 100
METRIC RATING
183rd/ 347
METRIC RANK
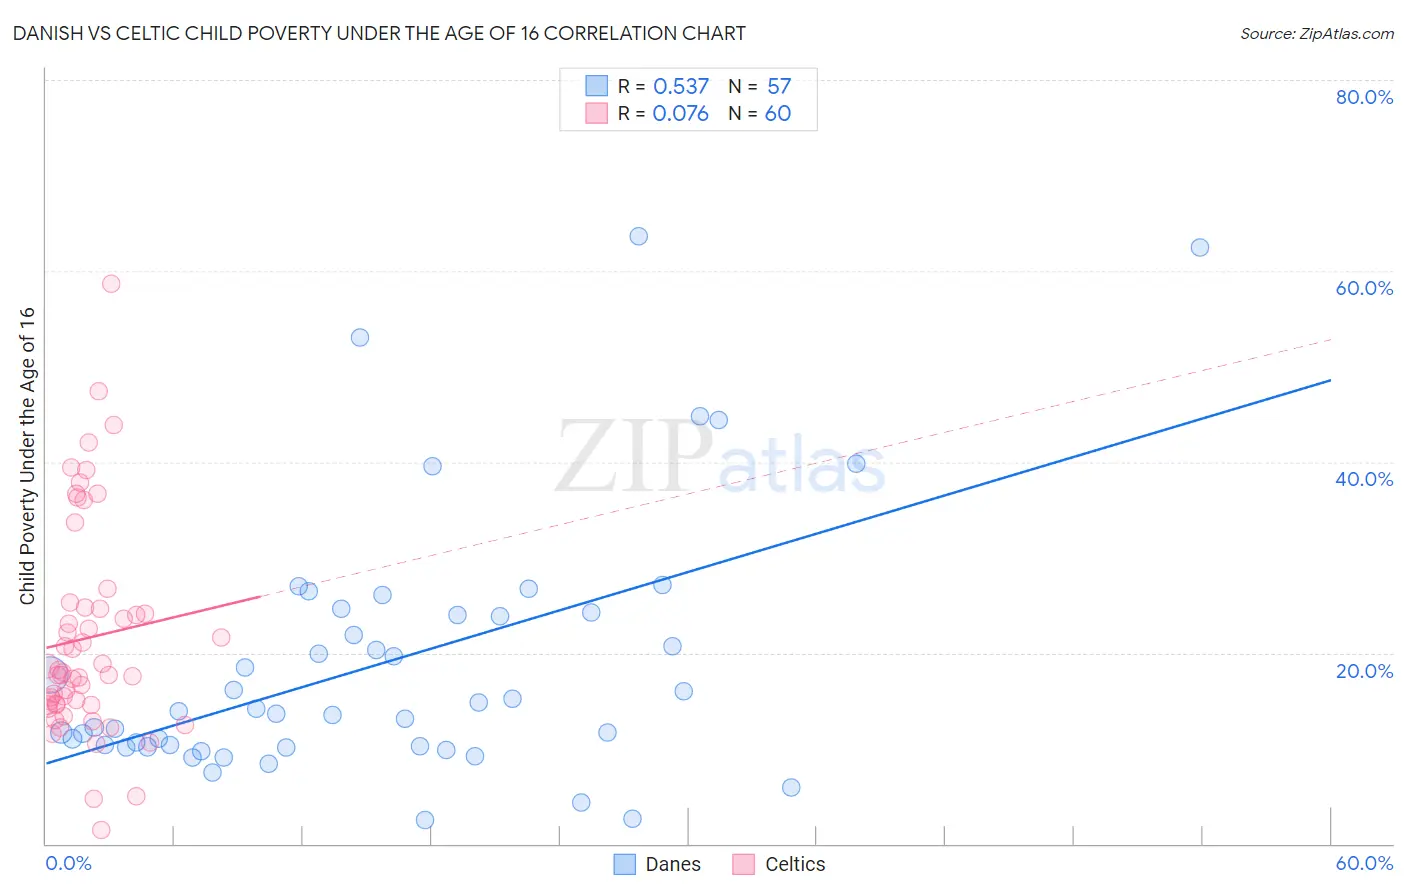
Danish vs Celtic Child Poverty Under the Age of 16 Correlation Chart
The statistical analysis conducted on geographies consisting of 466,828,359 people shows a substantial positive correlation between the proportion of Danes and poverty level among children under the age of 16 in the United States with a correlation coefficient (R) of 0.537 and weighted average of 13.4%. Similarly, the statistical analysis conducted on geographies consisting of 168,036,388 people shows a slight positive correlation between the proportion of Celtics and poverty level among children under the age of 16 in the United States with a correlation coefficient (R) of 0.076 and weighted average of 16.4%, a difference of 22.7%.
Child Poverty Under the Age of 16 Correlation Summary
| Measurement | Danish | Celtic |
| Minimum | 2.5% | 1.4% |
| Maximum | 63.6% | 58.6% |
| Range | 61.2% | 57.2% |
| Mean | 18.9% | 21.5% |
| Median | 13.9% | 17.8% |
| Interquartile 25% (IQ1) | 10.2% | 14.5% |
| Interquartile 75% (IQ3) | 24.1% | 24.6% |
| Interquartile Range (IQR) | 13.9% | 10.1% |
| Standard Deviation (Sample) | 13.6% | 11.2% |
| Standard Deviation (Population) | 13.5% | 11.1% |
Similar Demographics by Child Poverty Under the Age of 16
Demographics Similar to Danes by Child Poverty Under the Age of 16
In terms of child poverty under the age of 16, the demographic groups most similar to Danes are Tongan (13.4%, a difference of 0.010%), Turkish (13.4%, a difference of 0.21%), Asian (13.5%, a difference of 0.50%), Swedish (13.3%, a difference of 0.51%), and Assyrian/Chaldean/Syriac (13.3%, a difference of 0.68%).
| Demographics | Rating | Rank | Child Poverty Under the Age of 16 |
| Latvians | 99.8 /100 | #24 | Exceptional 13.2% |
| Eastern Europeans | 99.8 /100 | #25 | Exceptional 13.2% |
| Bolivians | 99.8 /100 | #26 | Exceptional 13.2% |
| Immigrants | China | 99.8 /100 | #27 | Exceptional 13.3% |
| Assyrians/Chaldeans/Syriacs | 99.7 /100 | #28 | Exceptional 13.3% |
| Swedes | 99.7 /100 | #29 | Exceptional 13.3% |
| Turks | 99.7 /100 | #30 | Exceptional 13.4% |
| Danes | 99.7 /100 | #31 | Exceptional 13.4% |
| Tongans | 99.7 /100 | #32 | Exceptional 13.4% |
| Asians | 99.6 /100 | #33 | Exceptional 13.5% |
| Russians | 99.6 /100 | #34 | Exceptional 13.5% |
| Lithuanians | 99.6 /100 | #35 | Exceptional 13.5% |
| Immigrants | Northern Europe | 99.6 /100 | #36 | Exceptional 13.6% |
| Immigrants | Bolivia | 99.6 /100 | #37 | Exceptional 13.6% |
| Luxembourgers | 99.5 /100 | #38 | Exceptional 13.6% |
Demographics Similar to Celtics by Child Poverty Under the Age of 16
In terms of child poverty under the age of 16, the demographic groups most similar to Celtics are Hawaiian (16.4%, a difference of 0.010%), Immigrants from Western Asia (16.4%, a difference of 0.020%), Immigrants from Bosnia and Herzegovina (16.5%, a difference of 0.10%), Immigrants from South America (16.4%, a difference of 0.33%), and South American Indian (16.4%, a difference of 0.46%).
| Demographics | Rating | Rank | Child Poverty Under the Age of 16 |
| Lebanese | 45.9 /100 | #176 | Average 16.3% |
| Ethiopians | 43.4 /100 | #177 | Average 16.3% |
| Immigrants | Ethiopia | 42.3 /100 | #178 | Average 16.4% |
| Immigrants | Syria | 42.3 /100 | #179 | Average 16.4% |
| South American Indians | 41.8 /100 | #180 | Average 16.4% |
| Immigrants | South America | 40.8 /100 | #181 | Average 16.4% |
| Hawaiians | 38.2 /100 | #182 | Fair 16.4% |
| Celtics | 38.2 /100 | #183 | Fair 16.4% |
| Immigrants | Western Asia | 38.0 /100 | #184 | Fair 16.4% |
| Immigrants | Bosnia and Herzegovina | 37.4 /100 | #185 | Fair 16.5% |
| Kenyans | 34.1 /100 | #186 | Fair 16.5% |
| Arabs | 31.4 /100 | #187 | Fair 16.6% |
| Immigrants | Morocco | 31.2 /100 | #188 | Fair 16.6% |
| Immigrants | Portugal | 30.0 /100 | #189 | Fair 16.6% |
| Immigrants | Costa Rica | 29.6 /100 | #190 | Fair 16.6% |