Czechoslovakian vs Comanche Child Poverty Among Boys Under 16
COMPARE
Czechoslovakian
Comanche
Child Poverty Among Boys Under 16
Child Poverty Among Boys Under 16 Comparison
Czechoslovakians
Comanche
15.3%
CHILD POVERTY AMONG BOYS UNDER 16
92.1/ 100
METRIC RATING
125th/ 347
METRIC RANK
20.1%
CHILD POVERTY AMONG BOYS UNDER 16
0.0/ 100
METRIC RATING
282nd/ 347
METRIC RANK
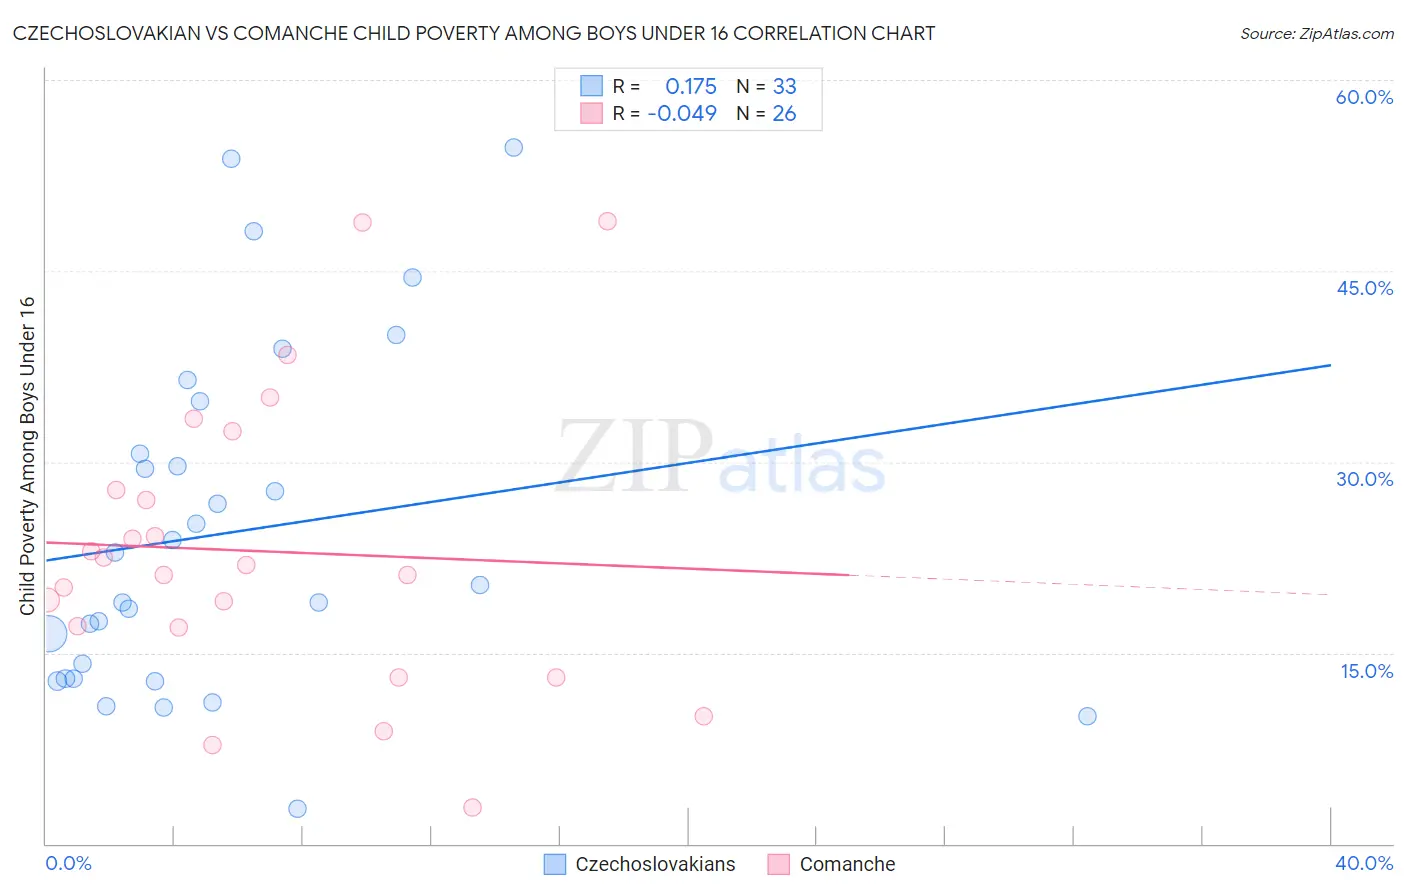
Czechoslovakian vs Comanche Child Poverty Among Boys Under 16 Correlation Chart
The statistical analysis conducted on geographies consisting of 361,979,827 people shows a poor positive correlation between the proportion of Czechoslovakians and poverty level among boys under the age of 16 in the United States with a correlation coefficient (R) of 0.175 and weighted average of 15.3%. Similarly, the statistical analysis conducted on geographies consisting of 109,333,383 people shows no correlation between the proportion of Comanche and poverty level among boys under the age of 16 in the United States with a correlation coefficient (R) of -0.049 and weighted average of 20.1%, a difference of 31.2%.
Child Poverty Among Boys Under 16 Correlation Summary
| Measurement | Czechoslovakian | Comanche |
| Minimum | 2.7% | 2.8% |
| Maximum | 54.7% | 48.9% |
| Range | 51.9% | 46.1% |
| Mean | 24.4% | 23.0% |
| Median | 20.3% | 21.5% |
| Interquartile 25% (IQ1) | 13.0% | 17.0% |
| Interquartile 75% (IQ3) | 32.7% | 27.8% |
| Interquartile Range (IQR) | 19.7% | 10.9% |
| Standard Deviation (Sample) | 13.3% | 11.5% |
| Standard Deviation (Population) | 13.1% | 11.2% |
Similar Demographics by Child Poverty Among Boys Under 16
Demographics Similar to Czechoslovakians by Child Poverty Among Boys Under 16
In terms of child poverty among boys under 16, the demographic groups most similar to Czechoslovakians are Tlingit-Haida (15.3%, a difference of 0.070%), Immigrants from Norway (15.3%, a difference of 0.080%), Immigrants from Malaysia (15.3%, a difference of 0.30%), Palestinian (15.4%, a difference of 0.31%), and Carpatho Rusyn (15.4%, a difference of 0.36%).
| Demographics | Rating | Rank | Child Poverty Among Boys Under 16 |
| Native Hawaiians | 93.4 /100 | #118 | Exceptional 15.2% |
| Belgians | 93.1 /100 | #119 | Exceptional 15.2% |
| South Africans | 93.0 /100 | #120 | Exceptional 15.2% |
| Scottish | 93.0 /100 | #121 | Exceptional 15.2% |
| Immigrants | Malaysia | 92.8 /100 | #122 | Exceptional 15.3% |
| Immigrants | Norway | 92.3 /100 | #123 | Exceptional 15.3% |
| Tlingit-Haida | 92.2 /100 | #124 | Exceptional 15.3% |
| Czechoslovakians | 92.1 /100 | #125 | Exceptional 15.3% |
| Palestinians | 91.3 /100 | #126 | Exceptional 15.4% |
| Carpatho Rusyns | 91.1 /100 | #127 | Exceptional 15.4% |
| Canadians | 90.6 /100 | #128 | Exceptional 15.4% |
| Immigrants | Brazil | 90.3 /100 | #129 | Exceptional 15.4% |
| Mongolians | 90.2 /100 | #130 | Exceptional 15.4% |
| Immigrants | Western Europe | 90.0 /100 | #131 | Exceptional 15.4% |
| Immigrants | Kazakhstan | 88.7 /100 | #132 | Excellent 15.5% |
Demographics Similar to Comanche by Child Poverty Among Boys Under 16
In terms of child poverty among boys under 16, the demographic groups most similar to Comanche are Immigrants from Zaire (20.1%, a difference of 0.050%), Central American (20.1%, a difference of 0.11%), Immigrants from Jamaica (20.1%, a difference of 0.13%), Bangladeshi (20.0%, a difference of 0.23%), and Immigrants from West Indies (20.0%, a difference of 0.36%).
| Demographics | Rating | Rank | Child Poverty Among Boys Under 16 |
| Jamaicans | 0.0 /100 | #275 | Tragic 20.0% |
| Sub-Saharan Africans | 0.0 /100 | #276 | Tragic 20.0% |
| Immigrants | Barbados | 0.0 /100 | #277 | Tragic 20.0% |
| Immigrants | West Indies | 0.0 /100 | #278 | Tragic 20.0% |
| Bangladeshis | 0.0 /100 | #279 | Tragic 20.0% |
| Central Americans | 0.0 /100 | #280 | Tragic 20.1% |
| Immigrants | Zaire | 0.0 /100 | #281 | Tragic 20.1% |
| Comanche | 0.0 /100 | #282 | Tragic 20.1% |
| Immigrants | Jamaica | 0.0 /100 | #283 | Tragic 20.1% |
| Barbadians | 0.0 /100 | #284 | Tragic 20.2% |
| Arapaho | 0.0 /100 | #285 | Tragic 20.2% |
| West Indians | 0.0 /100 | #286 | Tragic 20.3% |
| Immigrants | Belize | 0.0 /100 | #287 | Tragic 20.3% |
| Immigrants | St. Vincent and the Grenadines | 0.0 /100 | #288 | Tragic 20.3% |
| Blackfeet | 0.0 /100 | #289 | Tragic 20.4% |