Cuban vs Iranian Female Poverty Among 25-34 Year Olds
COMPARE
Cuban
Iranian
Female Poverty Among 25-34 Year Olds
Female Poverty Among 25-34 Year Olds Comparison
Cubans
Iranians
14.7%
FEMALE POVERTY AMONG 25-34 YEAR OLDS
1.6/ 100
METRIC RATING
234th/ 347
METRIC RANK
11.2%
FEMALE POVERTY AMONG 25-34 YEAR OLDS
100.0/ 100
METRIC RATING
19th/ 347
METRIC RANK
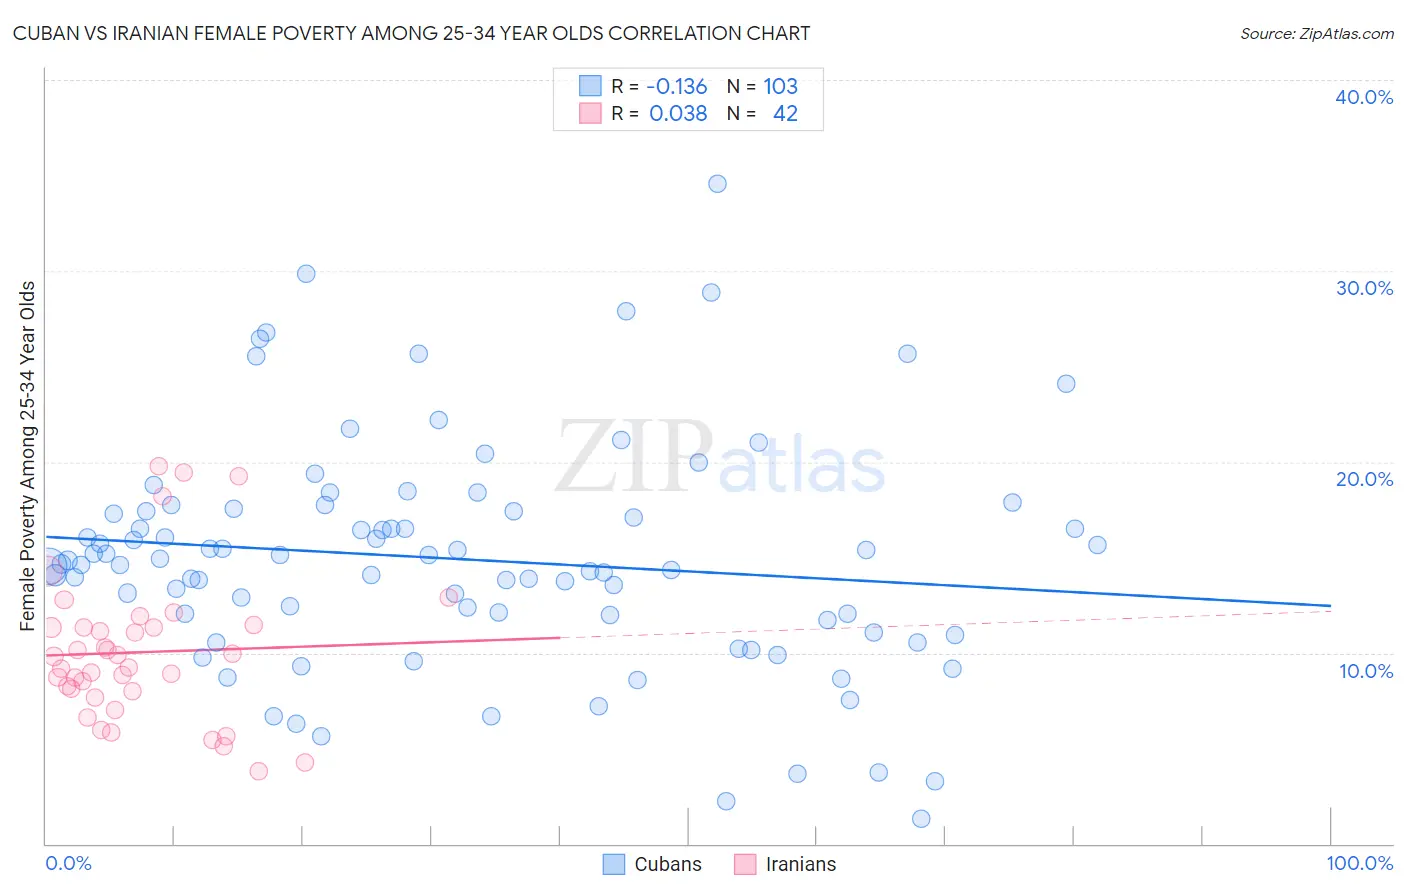
Cuban vs Iranian Female Poverty Among 25-34 Year Olds Correlation Chart
The statistical analysis conducted on geographies consisting of 440,903,752 people shows a poor negative correlation between the proportion of Cubans and poverty level among females between the ages 25 and 34 in the United States with a correlation coefficient (R) of -0.136 and weighted average of 14.7%. Similarly, the statistical analysis conducted on geographies consisting of 312,428,858 people shows no correlation between the proportion of Iranians and poverty level among females between the ages 25 and 34 in the United States with a correlation coefficient (R) of 0.038 and weighted average of 11.2%, a difference of 30.9%.
Female Poverty Among 25-34 Year Olds Correlation Summary
| Measurement | Cuban | Iranian |
| Minimum | 1.3% | 3.8% |
| Maximum | 34.5% | 19.8% |
| Range | 33.3% | 16.0% |
| Mean | 14.9% | 10.0% |
| Median | 14.7% | 9.5% |
| Interquartile 25% (IQ1) | 11.7% | 8.0% |
| Interquartile 75% (IQ3) | 17.4% | 11.3% |
| Interquartile Range (IQR) | 5.7% | 3.4% |
| Standard Deviation (Sample) | 6.0% | 3.8% |
| Standard Deviation (Population) | 6.0% | 3.8% |
Similar Demographics by Female Poverty Among 25-34 Year Olds
Demographics Similar to Cubans by Female Poverty Among 25-34 Year Olds
In terms of female poverty among 25-34 year olds, the demographic groups most similar to Cubans are Immigrants from Jamaica (14.7%, a difference of 0.18%), Salvadoran (14.7%, a difference of 0.20%), Immigrants from Ghana (14.7%, a difference of 0.20%), White/Caucasian (14.7%, a difference of 0.23%), and Alsatian (14.7%, a difference of 0.24%).
| Demographics | Rating | Rank | Female Poverty Among 25-34 Year Olds |
| Celtics | 2.8 /100 | #227 | Tragic 14.5% |
| Vietnamese | 2.6 /100 | #228 | Tragic 14.6% |
| Spanish | 2.5 /100 | #229 | Tragic 14.6% |
| Spaniards | 2.3 /100 | #230 | Tragic 14.6% |
| Delaware | 2.3 /100 | #231 | Tragic 14.6% |
| Immigrants | Ecuador | 1.9 /100 | #232 | Tragic 14.6% |
| Whites/Caucasians | 1.8 /100 | #233 | Tragic 14.7% |
| Cubans | 1.6 /100 | #234 | Tragic 14.7% |
| Immigrants | Jamaica | 1.4 /100 | #235 | Tragic 14.7% |
| Salvadorans | 1.4 /100 | #236 | Tragic 14.7% |
| Immigrants | Ghana | 1.4 /100 | #237 | Tragic 14.7% |
| Alsatians | 1.4 /100 | #238 | Tragic 14.7% |
| Malaysians | 1.4 /100 | #239 | Tragic 14.7% |
| Immigrants | Grenada | 1.3 /100 | #240 | Tragic 14.7% |
| Scotch-Irish | 1.2 /100 | #241 | Tragic 14.8% |
Demographics Similar to Iranians by Female Poverty Among 25-34 Year Olds
In terms of female poverty among 25-34 year olds, the demographic groups most similar to Iranians are Immigrants from Eastern Asia (11.2%, a difference of 0.14%), Immigrants from China (11.2%, a difference of 0.25%), Immigrants from Bolivia (11.2%, a difference of 0.32%), Assyrian/Chaldean/Syriac (11.2%, a difference of 0.36%), and Burmese (11.2%, a difference of 0.47%).
| Demographics | Rating | Rank | Female Poverty Among 25-34 Year Olds |
| Immigrants | Ireland | 100.0 /100 | #12 | Exceptional 11.2% |
| Burmese | 100.0 /100 | #13 | Exceptional 11.2% |
| Indians (Asian) | 100.0 /100 | #14 | Exceptional 11.2% |
| Assyrians/Chaldeans/Syriacs | 100.0 /100 | #15 | Exceptional 11.2% |
| Immigrants | Bolivia | 100.0 /100 | #16 | Exceptional 11.2% |
| Immigrants | China | 100.0 /100 | #17 | Exceptional 11.2% |
| Immigrants | Eastern Asia | 100.0 /100 | #18 | Exceptional 11.2% |
| Iranians | 100.0 /100 | #19 | Exceptional 11.2% |
| Okinawans | 100.0 /100 | #20 | Exceptional 11.3% |
| Turks | 100.0 /100 | #21 | Exceptional 11.4% |
| Asians | 99.9 /100 | #22 | Exceptional 11.4% |
| Bolivians | 99.9 /100 | #23 | Exceptional 11.4% |
| Maltese | 99.9 /100 | #24 | Exceptional 11.4% |
| Bhutanese | 99.9 /100 | #25 | Exceptional 11.4% |
| Tongans | 99.9 /100 | #26 | Exceptional 11.5% |