Cuban vs Immigrants from Norway Seniors Poverty Over the Age of 75
COMPARE
Cuban
Immigrants from Norway
Seniors Poverty Over the Age of 75
Seniors Poverty Over the Age of 75 Comparison
Cubans
Immigrants from Norway
18.0%
SENIORS POVERTY OVER THE AGE OF 75
0.0/ 100
METRIC RATING
335th/ 347
METRIC RANK
12.1%
SENIORS POVERTY OVER THE AGE OF 75
60.6/ 100
METRIC RATING
161st/ 347
METRIC RANK
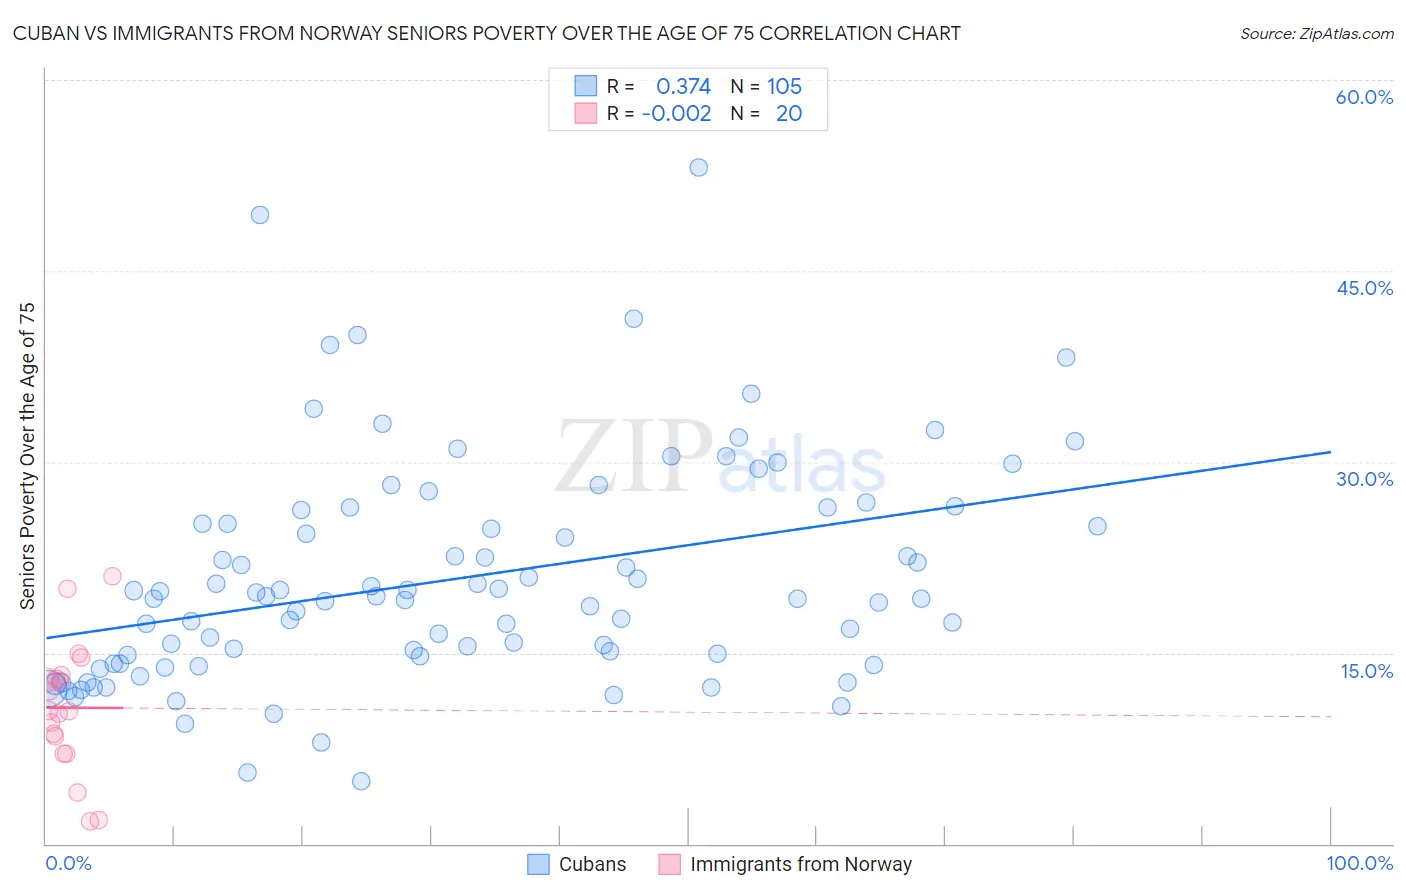
Cuban vs Immigrants from Norway Seniors Poverty Over the Age of 75 Correlation Chart
The statistical analysis conducted on geographies consisting of 443,347,202 people shows a mild positive correlation between the proportion of Cubans and poverty level among seniors over the age of 75 in the United States with a correlation coefficient (R) of 0.374 and weighted average of 18.0%. Similarly, the statistical analysis conducted on geographies consisting of 116,318,063 people shows no correlation between the proportion of Immigrants from Norway and poverty level among seniors over the age of 75 in the United States with a correlation coefficient (R) of -0.002 and weighted average of 12.1%, a difference of 48.6%.
Seniors Poverty Over the Age of 75 Correlation Summary
| Measurement | Cuban | Immigrants from Norway |
| Minimum | 4.9% | 1.8% |
| Maximum | 53.2% | 21.0% |
| Range | 48.3% | 19.2% |
| Mean | 20.8% | 10.7% |
| Median | 19.2% | 10.4% |
| Interquartile 25% (IQ1) | 14.5% | 7.8% |
| Interquartile 75% (IQ3) | 25.7% | 13.1% |
| Interquartile Range (IQR) | 11.2% | 5.3% |
| Standard Deviation (Sample) | 8.7% | 5.1% |
| Standard Deviation (Population) | 8.7% | 4.9% |
Similar Demographics by Seniors Poverty Over the Age of 75
Demographics Similar to Cubans by Seniors Poverty Over the Age of 75
In terms of seniors poverty over the age of 75, the demographic groups most similar to Cubans are Immigrants from Grenada (17.8%, a difference of 0.59%), Immigrants from Caribbean (18.2%, a difference of 1.6%), Yakama (18.3%, a difference of 2.1%), Immigrants from Nicaragua (17.6%, a difference of 2.1%), and Immigrants from St. Vincent and the Grenadines (17.5%, a difference of 2.6%).
| Demographics | Rating | Rank | Seniors Poverty Over the Age of 75 |
| Cape Verdeans | 0.0 /100 | #328 | Tragic 16.8% |
| Immigrants | Dominica | 0.0 /100 | #329 | Tragic 17.0% |
| British West Indians | 0.0 /100 | #330 | Tragic 17.4% |
| Immigrants | Armenia | 0.0 /100 | #331 | Tragic 17.5% |
| Immigrants | St. Vincent and the Grenadines | 0.0 /100 | #332 | Tragic 17.5% |
| Immigrants | Nicaragua | 0.0 /100 | #333 | Tragic 17.6% |
| Immigrants | Grenada | 0.0 /100 | #334 | Tragic 17.8% |
| Cubans | 0.0 /100 | #335 | Tragic 18.0% |
| Immigrants | Caribbean | 0.0 /100 | #336 | Tragic 18.2% |
| Yakama | 0.0 /100 | #337 | Tragic 18.3% |
| Immigrants | Cabo Verde | 0.0 /100 | #338 | Tragic 18.5% |
| Hopi | 0.0 /100 | #339 | Tragic 18.9% |
| Tohono O'odham | 0.0 /100 | #340 | Tragic 19.1% |
| Navajo | 0.0 /100 | #341 | Tragic 19.4% |
| Dominicans | 0.0 /100 | #342 | Tragic 19.6% |
Demographics Similar to Immigrants from Norway by Seniors Poverty Over the Age of 75
In terms of seniors poverty over the age of 75, the demographic groups most similar to Immigrants from Norway are Immigrants from Eastern Africa (12.1%, a difference of 0.020%), Immigrants from Serbia (12.1%, a difference of 0.030%), Immigrants from Middle Africa (12.1%, a difference of 0.050%), Portuguese (12.1%, a difference of 0.060%), and Immigrants from Sudan (12.1%, a difference of 0.090%).
| Demographics | Rating | Rank | Seniors Poverty Over the Age of 75 |
| Cambodians | 64.0 /100 | #154 | Good 12.0% |
| Indonesians | 62.6 /100 | #155 | Good 12.1% |
| Immigrants | Burma/Myanmar | 62.3 /100 | #156 | Good 12.1% |
| Immigrants | Sudan | 61.7 /100 | #157 | Good 12.1% |
| Portuguese | 61.3 /100 | #158 | Good 12.1% |
| Immigrants | Middle Africa | 61.2 /100 | #159 | Good 12.1% |
| Immigrants | Eastern Africa | 60.9 /100 | #160 | Good 12.1% |
| Immigrants | Norway | 60.6 /100 | #161 | Good 12.1% |
| Immigrants | Serbia | 60.2 /100 | #162 | Good 12.1% |
| Immigrants | Greece | 58.2 /100 | #163 | Average 12.1% |
| Potawatomi | 57.4 /100 | #164 | Average 12.1% |
| Okinawans | 56.3 /100 | #165 | Average 12.1% |
| Egyptians | 54.8 /100 | #166 | Average 12.1% |
| Immigrants | Switzerland | 54.5 /100 | #167 | Average 12.1% |
| Immigrants | Syria | 53.9 /100 | #168 | Average 12.2% |