Crow vs Immigrants from Morocco Single Mother Poverty
COMPARE
Crow
Immigrants from Morocco
Single Mother Poverty
Single Mother Poverty Comparison
Crow
Immigrants from Morocco
38.6%
SINGLE MOTHER POVERTY
0.0/ 100
METRIC RATING
339th/ 347
METRIC RANK
28.4%
SINGLE MOTHER POVERTY
89.5/ 100
METRIC RATING
132nd/ 347
METRIC RANK
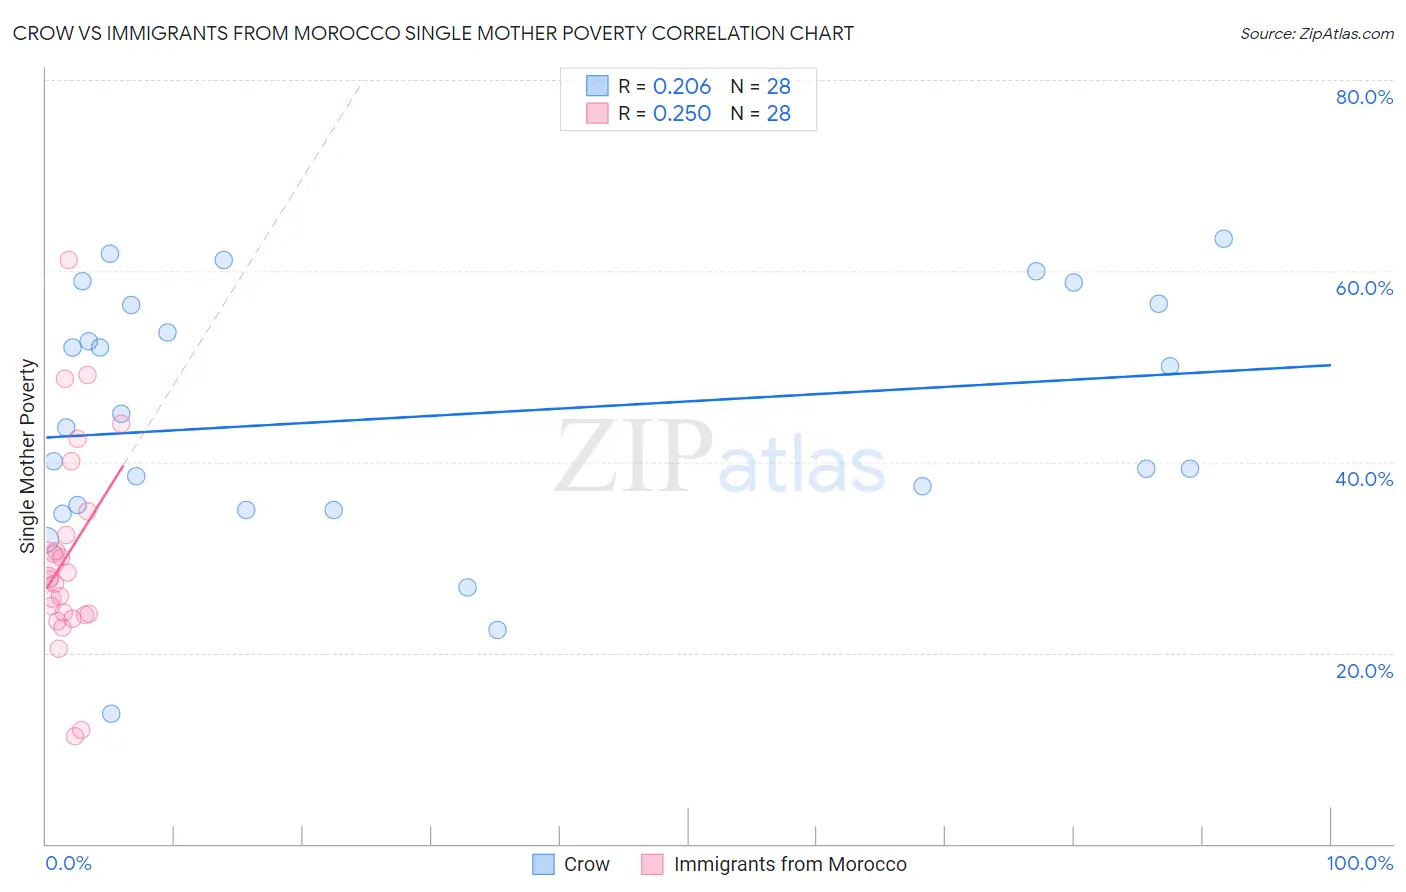
Crow vs Immigrants from Morocco Single Mother Poverty Correlation Chart
The statistical analysis conducted on geographies consisting of 58,942,445 people shows a weak positive correlation between the proportion of Crow and poverty level among single mothers in the United States with a correlation coefficient (R) of 0.206 and weighted average of 38.6%. Similarly, the statistical analysis conducted on geographies consisting of 176,937,771 people shows a weak positive correlation between the proportion of Immigrants from Morocco and poverty level among single mothers in the United States with a correlation coefficient (R) of 0.250 and weighted average of 28.4%, a difference of 35.9%.
Single Mother Poverty Correlation Summary
| Measurement | Crow | Immigrants from Morocco |
| Minimum | 13.6% | 11.2% |
| Maximum | 63.4% | 61.2% |
| Range | 49.8% | 49.9% |
| Mean | 44.8% | 30.2% |
| Median | 44.3% | 27.8% |
| Interquartile 25% (IQ1) | 35.2% | 24.0% |
| Interquartile 75% (IQ3) | 56.5% | 33.6% |
| Interquartile Range (IQR) | 21.3% | 9.6% |
| Standard Deviation (Sample) | 13.0% | 11.0% |
| Standard Deviation (Population) | 12.8% | 10.8% |
Similar Demographics by Single Mother Poverty
Demographics Similar to Crow by Single Mother Poverty
In terms of single mother poverty, the demographic groups most similar to Crow are Pima (38.6%, a difference of 0.090%), Immigrants from Yemen (38.5%, a difference of 0.30%), Cheyenne (38.5%, a difference of 0.34%), Sioux (38.8%, a difference of 0.40%), and Colville (39.3%, a difference of 1.7%).
| Demographics | Rating | Rank | Single Mother Poverty |
| Dutch West Indians | 0.0 /100 | #332 | Tragic 36.8% |
| Menominee | 0.0 /100 | #333 | Tragic 37.1% |
| Pueblo | 0.0 /100 | #334 | Tragic 37.2% |
| Yuman | 0.0 /100 | #335 | Tragic 37.8% |
| Cheyenne | 0.0 /100 | #336 | Tragic 38.5% |
| Immigrants | Yemen | 0.0 /100 | #337 | Tragic 38.5% |
| Pima | 0.0 /100 | #338 | Tragic 38.6% |
| Crow | 0.0 /100 | #339 | Tragic 38.6% |
| Sioux | 0.0 /100 | #340 | Tragic 38.8% |
| Colville | 0.0 /100 | #341 | Tragic 39.3% |
| Navajo | 0.0 /100 | #342 | Tragic 40.2% |
| Cajuns | 0.0 /100 | #343 | Tragic 40.3% |
| Tohono O'odham | 0.0 /100 | #344 | Tragic 43.0% |
| Lumbee | 0.0 /100 | #345 | Tragic 43.2% |
| Houma | 0.0 /100 | #346 | Tragic 43.5% |
Demographics Similar to Immigrants from Morocco by Single Mother Poverty
In terms of single mother poverty, the demographic groups most similar to Immigrants from Morocco are Swedish (28.4%, a difference of 0.0%), Immigrants from Southern Europe (28.4%, a difference of 0.030%), Immigrants from Spain (28.4%, a difference of 0.030%), Native Hawaiian (28.4%, a difference of 0.070%), and Immigrants from Canada (28.4%, a difference of 0.070%).
| Demographics | Rating | Rank | Single Mother Poverty |
| Kenyans | 90.9 /100 | #125 | Exceptional 28.4% |
| Immigrants | Chile | 90.8 /100 | #126 | Exceptional 28.4% |
| Poles | 90.8 /100 | #127 | Exceptional 28.4% |
| Immigrants | England | 90.5 /100 | #128 | Exceptional 28.4% |
| South Americans | 90.4 /100 | #129 | Exceptional 28.4% |
| Norwegians | 90.4 /100 | #130 | Exceptional 28.4% |
| Immigrants | Austria | 90.3 /100 | #131 | Exceptional 28.4% |
| Immigrants | Morocco | 89.5 /100 | #132 | Excellent 28.4% |
| Swedes | 89.4 /100 | #133 | Excellent 28.4% |
| Immigrants | Southern Europe | 89.2 /100 | #134 | Excellent 28.4% |
| Immigrants | Spain | 89.2 /100 | #135 | Excellent 28.4% |
| Native Hawaiians | 88.9 /100 | #136 | Excellent 28.4% |
| Immigrants | Canada | 88.9 /100 | #137 | Excellent 28.4% |
| Immigrants | Belgium | 88.5 /100 | #138 | Excellent 28.5% |
| Samoans | 88.1 /100 | #139 | Excellent 28.5% |