Croatian vs Yugoslavian Single Male Poverty
COMPARE
Croatian
Yugoslavian
Single Male Poverty
Single Male Poverty Comparison
Croatians
Yugoslavians
12.8%
SINGLE MALE POVERTY
48.9/ 100
METRIC RATING
175th/ 347
METRIC RANK
12.6%
SINGLE MALE POVERTY
73.9/ 100
METRIC RATING
148th/ 347
METRIC RANK
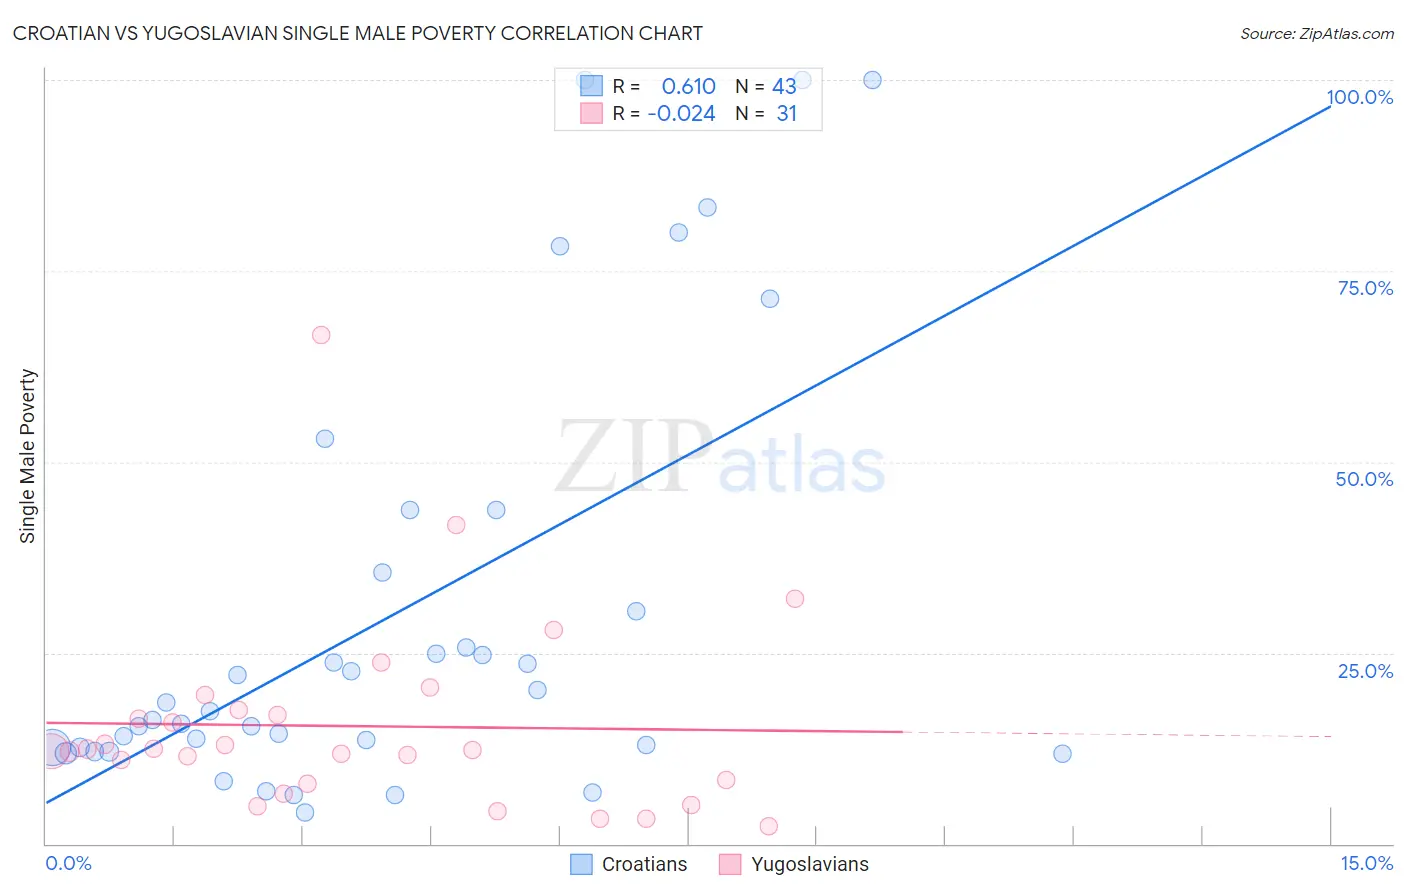
Croatian vs Yugoslavian Single Male Poverty Correlation Chart
The statistical analysis conducted on geographies consisting of 328,638,760 people shows a significant positive correlation between the proportion of Croatians and poverty level among single males in the United States with a correlation coefficient (R) of 0.610 and weighted average of 12.8%. Similarly, the statistical analysis conducted on geographies consisting of 258,600,754 people shows no correlation between the proportion of Yugoslavians and poverty level among single males in the United States with a correlation coefficient (R) of -0.024 and weighted average of 12.6%, a difference of 1.5%.
Single Male Poverty Correlation Summary
| Measurement | Croatian | Yugoslavian |
| Minimum | 4.2% | 2.3% |
| Maximum | 100.0% | 66.7% |
| Range | 95.8% | 64.4% |
| Mean | 29.9% | 15.4% |
| Median | 17.3% | 12.3% |
| Interquartile 25% (IQ1) | 12.5% | 7.9% |
| Interquartile 75% (IQ3) | 35.6% | 17.6% |
| Interquartile Range (IQR) | 23.0% | 9.7% |
| Standard Deviation (Sample) | 28.1% | 12.9% |
| Standard Deviation (Population) | 27.7% | 12.7% |
Similar Demographics by Single Male Poverty
Demographics Similar to Croatians by Single Male Poverty
In terms of single male poverty, the demographic groups most similar to Croatians are Syrian (12.8%, a difference of 0.020%), Costa Rican (12.8%, a difference of 0.060%), Immigrants from St. Vincent and the Grenadines (12.8%, a difference of 0.11%), South African (12.8%, a difference of 0.14%), and Danish (12.8%, a difference of 0.14%).
| Demographics | Rating | Rank | Single Male Poverty |
| Immigrants | Barbados | 57.7 /100 | #168 | Average 12.7% |
| Puget Sound Salish | 54.3 /100 | #169 | Average 12.8% |
| Guyanese | 52.0 /100 | #170 | Average 12.8% |
| South Africans | 51.5 /100 | #171 | Average 12.8% |
| Danes | 51.4 /100 | #172 | Average 12.8% |
| Immigrants | St. Vincent and the Grenadines | 50.9 /100 | #173 | Average 12.8% |
| Costa Ricans | 50.0 /100 | #174 | Average 12.8% |
| Croatians | 48.9 /100 | #175 | Average 12.8% |
| Syrians | 48.4 /100 | #176 | Average 12.8% |
| Immigrants | Canada | 44.8 /100 | #177 | Average 12.8% |
| Immigrants | Switzerland | 43.1 /100 | #178 | Average 12.8% |
| Israelis | 41.0 /100 | #179 | Average 12.9% |
| Immigrants | North America | 37.7 /100 | #180 | Fair 12.9% |
| Panamanians | 37.6 /100 | #181 | Fair 12.9% |
| Moroccans | 36.8 /100 | #182 | Fair 12.9% |
Demographics Similar to Yugoslavians by Single Male Poverty
In terms of single male poverty, the demographic groups most similar to Yugoslavians are Malaysian (12.6%, a difference of 0.060%), Immigrants from Lebanon (12.6%, a difference of 0.070%), Native Hawaiian (12.6%, a difference of 0.070%), Sierra Leonean (12.6%, a difference of 0.070%), and Hawaiian (12.6%, a difference of 0.080%).
| Demographics | Rating | Rank | Single Male Poverty |
| Okinawans | 75.9 /100 | #141 | Good 12.6% |
| Immigrants | Uganda | 75.9 /100 | #142 | Good 12.6% |
| Immigrants | France | 75.8 /100 | #143 | Good 12.6% |
| Hawaiians | 75.1 /100 | #144 | Good 12.6% |
| Immigrants | Lebanon | 75.0 /100 | #145 | Good 12.6% |
| Native Hawaiians | 75.0 /100 | #146 | Good 12.6% |
| Malaysians | 74.8 /100 | #147 | Good 12.6% |
| Yugoslavians | 73.9 /100 | #148 | Good 12.6% |
| Sierra Leoneans | 73.0 /100 | #149 | Good 12.6% |
| Immigrants | Panama | 72.1 /100 | #150 | Good 12.6% |
| Immigrants | Hungary | 71.9 /100 | #151 | Good 12.6% |
| Australians | 71.4 /100 | #152 | Good 12.6% |
| Immigrants | Immigrants | 70.1 /100 | #153 | Good 12.7% |
| Immigrants | Scotland | 68.9 /100 | #154 | Good 12.7% |
| Immigrants | Spain | 68.7 /100 | #155 | Good 12.7% |