Cree vs Zimbabwean Single Male Poverty
COMPARE
Cree
Zimbabwean
Single Male Poverty
Single Male Poverty Comparison
Cree
Zimbabweans
15.1%
SINGLE MALE POVERTY
0.0/ 100
METRIC RATING
300th/ 347
METRIC RANK
13.1%
SINGLE MALE POVERTY
14.9/ 100
METRIC RATING
214th/ 347
METRIC RANK
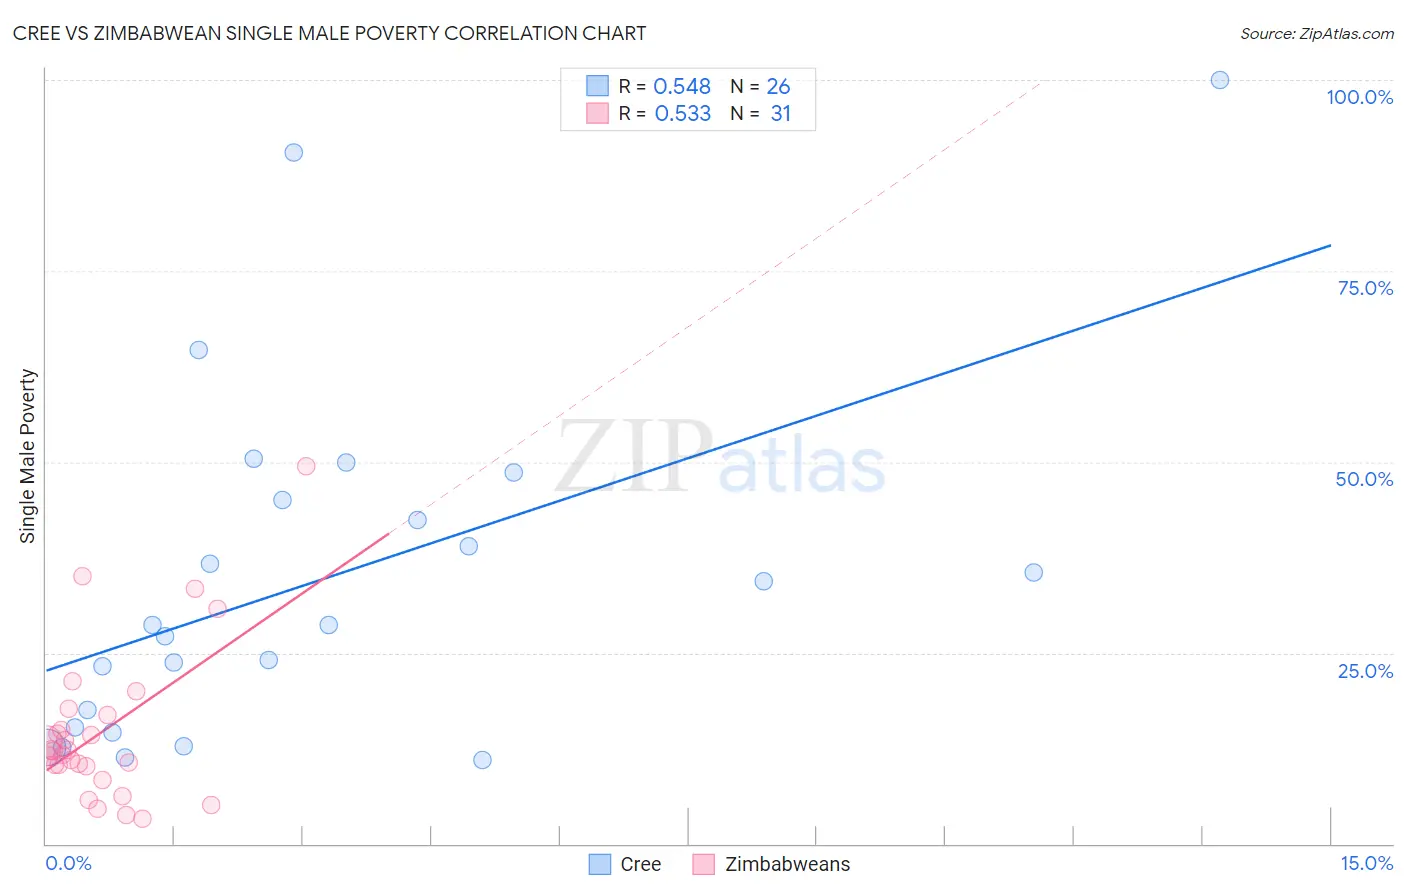
Cree vs Zimbabwean Single Male Poverty Correlation Chart
The statistical analysis conducted on geographies consisting of 73,575,391 people shows a substantial positive correlation between the proportion of Cree and poverty level among single males in the United States with a correlation coefficient (R) of 0.548 and weighted average of 15.1%. Similarly, the statistical analysis conducted on geographies consisting of 66,821,414 people shows a substantial positive correlation between the proportion of Zimbabweans and poverty level among single males in the United States with a correlation coefficient (R) of 0.533 and weighted average of 13.1%, a difference of 15.3%.
Single Male Poverty Correlation Summary
| Measurement | Cree | Zimbabwean |
| Minimum | 11.0% | 3.2% |
| Maximum | 100.0% | 49.4% |
| Range | 89.0% | 46.2% |
| Mean | 34.6% | 14.7% |
| Median | 28.6% | 12.2% |
| Interquartile 25% (IQ1) | 15.2% | 10.2% |
| Interquartile 75% (IQ3) | 45.0% | 16.9% |
| Interquartile Range (IQR) | 29.8% | 6.7% |
| Standard Deviation (Sample) | 23.1% | 10.2% |
| Standard Deviation (Population) | 22.6% | 10.0% |
Similar Demographics by Single Male Poverty
Demographics Similar to Cree by Single Male Poverty
In terms of single male poverty, the demographic groups most similar to Cree are Delaware (15.0%, a difference of 0.45%), Dominican (15.2%, a difference of 0.82%), French American Indian (15.0%, a difference of 0.84%), Alsatian (15.2%, a difference of 0.98%), and Aleut (15.4%, a difference of 2.0%).
| Demographics | Rating | Rank | Single Male Poverty |
| French Canadians | 0.0 /100 | #293 | Tragic 14.6% |
| Ottawa | 0.0 /100 | #294 | Tragic 14.6% |
| Scotch-Irish | 0.0 /100 | #295 | Tragic 14.7% |
| Africans | 0.0 /100 | #296 | Tragic 14.7% |
| Immigrants | Dominican Republic | 0.0 /100 | #297 | Tragic 14.8% |
| French American Indians | 0.0 /100 | #298 | Tragic 15.0% |
| Delaware | 0.0 /100 | #299 | Tragic 15.0% |
| Cree | 0.0 /100 | #300 | Tragic 15.1% |
| Dominicans | 0.0 /100 | #301 | Tragic 15.2% |
| Alsatians | 0.0 /100 | #302 | Tragic 15.2% |
| Aleuts | 0.0 /100 | #303 | Tragic 15.4% |
| Alaska Natives | 0.0 /100 | #304 | Tragic 15.4% |
| Blackfeet | 0.0 /100 | #305 | Tragic 15.5% |
| Pennsylvania Germans | 0.0 /100 | #306 | Tragic 15.6% |
| Ute | 0.0 /100 | #307 | Tragic 15.7% |
Demographics Similar to Zimbabweans by Single Male Poverty
In terms of single male poverty, the demographic groups most similar to Zimbabweans are Japanese (13.1%, a difference of 0.010%), Italian (13.1%, a difference of 0.090%), Austrian (13.1%, a difference of 0.10%), Senegalese (13.1%, a difference of 0.15%), and Swedish (13.1%, a difference of 0.18%).
| Demographics | Rating | Rank | Single Male Poverty |
| Sudanese | 17.7 /100 | #207 | Poor 13.1% |
| Immigrants | Western Africa | 17.6 /100 | #208 | Poor 13.1% |
| Mexican American Indians | 17.5 /100 | #209 | Poor 13.1% |
| Immigrants | Haiti | 16.8 /100 | #210 | Poor 13.1% |
| Swedes | 16.8 /100 | #211 | Poor 13.1% |
| Senegalese | 16.4 /100 | #212 | Poor 13.1% |
| Italians | 15.9 /100 | #213 | Poor 13.1% |
| Zimbabweans | 14.9 /100 | #214 | Poor 13.1% |
| Japanese | 14.8 /100 | #215 | Poor 13.1% |
| Austrians | 13.9 /100 | #216 | Poor 13.1% |
| Bermudans | 13.0 /100 | #217 | Poor 13.1% |
| Scandinavians | 12.9 /100 | #218 | Poor 13.1% |
| Immigrants | Burma/Myanmar | 12.6 /100 | #219 | Poor 13.1% |
| Central Americans | 10.9 /100 | #220 | Poor 13.2% |
| New Zealanders | 10.7 /100 | #221 | Poor 13.2% |