Colombian vs Immigrants from Somalia Single Father Poverty

COMPARE

Colombian
Race
Ancestry
AfghanAfricanAlaska NativeAlaskan AthabascanAlbanianAleutAlsatianAmericanApacheArabArapahoArgentineanArmenianAssyrian/Chaldean/SyriacAustralianAustrianBahamianBangladeshiBarbadianBasqueBelgianBelizeanBermudanBhutaneseBlackfeetBolivianBrazilianBritishBritish West IndianBulgarianBurmeseCajunCambodianCanadianCape VerdeanCarpatho RusynCelticCentral AmericanCentral American IndianCherokeeCheyenneChickasawChileanChineseChippewaChoctawColombianColvilleComancheCosta RicanCreeCreekCroatianCrowCubanCypriotCzechCzechoslovakianDanishDelawareDominicanDutchDutch West IndianEastern EuropeanEcuadorianEgyptianEnglishEstonianEthiopianEuropeanFijianFilipinoFinnishFrenchFrench American IndianFrench CanadianGermanGerman RussianGhanaianGreekGuamanian/ChamorroGuatemalanGuyaneseHaitianHmongHonduranHopiHoumaHungarianIcelanderIndian (Asian)IndonesianInupiatIranianIraqiIrishIroquoisIsraeliItalianJamaicanJapaneseJordanianKenyanKiowaKoreanLaotianLatvianLebaneseLiberianLithuanianLumbeeLuxembourgerMacedonianMalaysianMalteseMarshalleseMenomineeMexicanMexican American IndianMongolianMoroccanNative HawaiianNavajoNepaleseNew ZealanderNicaraguanNigerianNorthern EuropeanNorwegianOkinawanOsageOttawaPaiutePakistaniPalestinianPanamanianParaguayanPennsylvania GermanPeruvianPimaPolishPortuguesePotawatomiPuebloPuerto RicanPuget Sound SalishRomanianRussianSalvadoranSamoanScandinavianScotch-IrishScottishSeminoleSenegaleseSerbianShoshoneSierra LeoneanSiouxSlavicSlovakSloveneSomaliSouth AfricanSouth AmericanSouth American IndianSoviet UnionSpaniardSpanishSpanish AmericanSpanish American IndianSri LankanSubsaharan AfricanSudaneseSwedishSwissSyrianTaiwaneseThaiTlingit-HaidaTohono O'OdhamTonganTrinidadian and TobagonianTsimshianTurkishU.S. Virgin IslanderUgandanUkrainianUruguayanUteVenezuelanVietnameseWelshWest IndianYakamaYaquiYugoslavianYumanYup'ikZimbabwean
Immigration
NonimmigrantsImmigrantsAfghanistanAfricaAlbaniaArgentinaArmeniaAsiaAustraliaAustriaBahamasBangladeshBarbadosBelarusBelgiumBelizeBoliviaBosnia and HerzegovinaBrazilBulgariaBurma/MyanmarCabo VerdeCambodiaCameroonCanadaCaribbeanCentral AmericaChileChinaColombiaCongoCosta RicaCroatiaCubaCzechoslovakiaDenmarkDominicaDominican RepublicEastern AfricaEastern AsiaEastern EuropeEcuadorEgyptEl SalvadorEnglandEritreaEthiopiaEuropeFijiFranceGermanyGhanaGreeceGrenadaGuatemalaGuyanaHaitiHondurasHong KongHungaryIndiaIndonesiaIranIraqIrelandIsraelItalyJamaicaJapanJordanKazakhstanKenyaKoreaKuwaitLaosLatin AmericaLatviaLebanonLiberiaLithuaniaMalaysiaMexicoMicronesiaMiddle AfricaMoldovaMoroccoNepalNetherlandsNicaraguaNigeriaNorth AmericaNorth MacedoniaNorthern AfricaNorthern EuropeNorwayOceaniaPakistanPanamaPeruPhilippinesPolandPortugalRomaniaRussiaSaudi ArabiaScotlandSenegalSerbiaSierra LeoneSingaporeSouth AfricaSouth AmericaSouth Central AsiaSouth Eastern AsiaSouthern EuropeSpainSri LankaSt. Vincent and the GrenadinesSudanSwedenSwitzerlandSyriaTaiwanThailandTrinidad and TobagoTurkeyUgandaUkraineUruguayUzbekistanVenezuelaVietnamWest IndiesWestern AfricaWestern AsiaWestern EuropeYemenZaireZimbabweAzores
Immigrants from Somalia
Race
Ancestry
AfghanAfricanAlaska NativeAlaskan AthabascanAlbanianAleutAlsatianAmericanApacheArabArapahoArgentineanArmenianAssyrian/Chaldean/SyriacAustralianAustrianBahamianBangladeshiBarbadianBasqueBelgianBelizeanBermudanBhutaneseBlackfeetBolivianBrazilianBritishBritish West IndianBulgarianBurmeseCajunCambodianCanadianCape VerdeanCarpatho RusynCelticCentral AmericanCentral American IndianCherokeeCheyenneChickasawChileanChineseChippewaChoctawColvilleComancheCosta RicanCreeCreekCroatianCrowCubanCypriotCzechCzechoslovakianDanishDelawareDominicanDutchDutch West IndianEastern EuropeanEcuadorianEgyptianEnglishEstonianEthiopianEuropeanFijianFilipinoFinnishFrenchFrench American IndianFrench CanadianGermanGerman RussianGhanaianGreekGuamanian/ChamorroGuatemalanGuyaneseHaitianHmongHonduranHopiHoumaHungarianIcelanderIndian (Asian)IndonesianInupiatIranianIraqiIrishIroquoisIsraeliItalianJamaicanJapaneseJordanianKenyanKiowaKoreanLaotianLatvianLebaneseLiberianLithuanianLumbeeLuxembourgerMacedonianMalaysianMalteseMarshalleseMenomineeMexicanMexican American IndianMongolianMoroccanNative HawaiianNavajoNepaleseNew ZealanderNicaraguanNigerianNorthern EuropeanNorwegianOkinawanOsageOttawaPaiutePakistaniPalestinianPanamanianParaguayanPennsylvania GermanPeruvianPimaPolishPortuguesePotawatomiPuebloPuerto RicanPuget Sound SalishRomanianRussianSalvadoranSamoanScandinavianScotch-IrishScottishSeminoleSenegaleseSerbianShoshoneSierra LeoneanSiouxSlavicSlovakSloveneSomaliSouth AfricanSouth AmericanSouth American IndianSoviet UnionSpaniardSpanishSpanish AmericanSpanish American IndianSri LankanSubsaharan AfricanSudaneseSwedishSwissSyrianTaiwaneseThaiTlingit-HaidaTohono O'OdhamTonganTrinidadian and TobagonianTsimshianTurkishU.S. Virgin IslanderUgandanUkrainianUruguayanUteVenezuelanVietnameseWelshWest IndianYakamaYaquiYugoslavianYumanYup'ikZimbabwean
Immigration
NonimmigrantsImmigrantsAfghanistanAfricaAlbaniaArgentinaArmeniaAsiaAustraliaAustriaBahamasBangladeshBarbadosBelarusBelgiumBelizeBoliviaBosnia and HerzegovinaBrazilBulgariaBurma/MyanmarCabo VerdeCambodiaCameroonCanadaCaribbeanCentral AmericaChileChinaColombiaCongoCosta RicaCroatiaCubaCzechoslovakiaDenmarkDominicaDominican RepublicEastern AfricaEastern AsiaEastern EuropeEcuadorEgyptEl SalvadorEnglandEritreaEthiopiaEuropeFijiFranceGermanyGhanaGreeceGrenadaGuatemalaGuyanaHaitiHondurasHong KongHungaryIndiaIndonesiaIranIraqIrelandIsraelItalyJamaicaJapanJordanKazakhstanKenyaKoreaKuwaitLaosLatin AmericaLatviaLebanonLiberiaLithuaniaMalaysiaMexicoMicronesiaMiddle AfricaMoldovaMoroccoNepalNetherlandsNicaraguaNigeriaNorth AmericaNorth MacedoniaNorthern AfricaNorthern EuropeNorwayOceaniaPakistanPanamaPeruPhilippinesPolandPortugalRomaniaRussiaSaudi ArabiaScotlandSenegalSerbiaSierra LeoneSingaporeSomaliaSouth AfricaSouth AmericaSouth Central AsiaSouth Eastern AsiaSouthern EuropeSpainSri LankaSt. Vincent and the GrenadinesSudanSwedenSwitzerlandSyriaTaiwanThailandTrinidad and TobagoTurkeyUgandaUkraineUruguayUzbekistanVenezuelaVietnamWest IndiesWestern AfricaWestern AsiaWestern EuropeYemenZaireZimbabweAzores
Single Father Poverty
Income
Poverty
Unemployment
Labor Participation
Family Structure
Vehicle Availability
Education Level
Disability

Single Father Poverty Comparison

Colombians

Immigrants from Somalia

Good
Exceptional
16.1%
SINGLE FATHER POVERTY
77.1/ 100
METRIC RATING
147th/ 347
METRIC RANK
14.9%
SINGLE FATHER POVERTY
100.0/ 100
METRIC RATING
45th/ 347
METRIC RANK

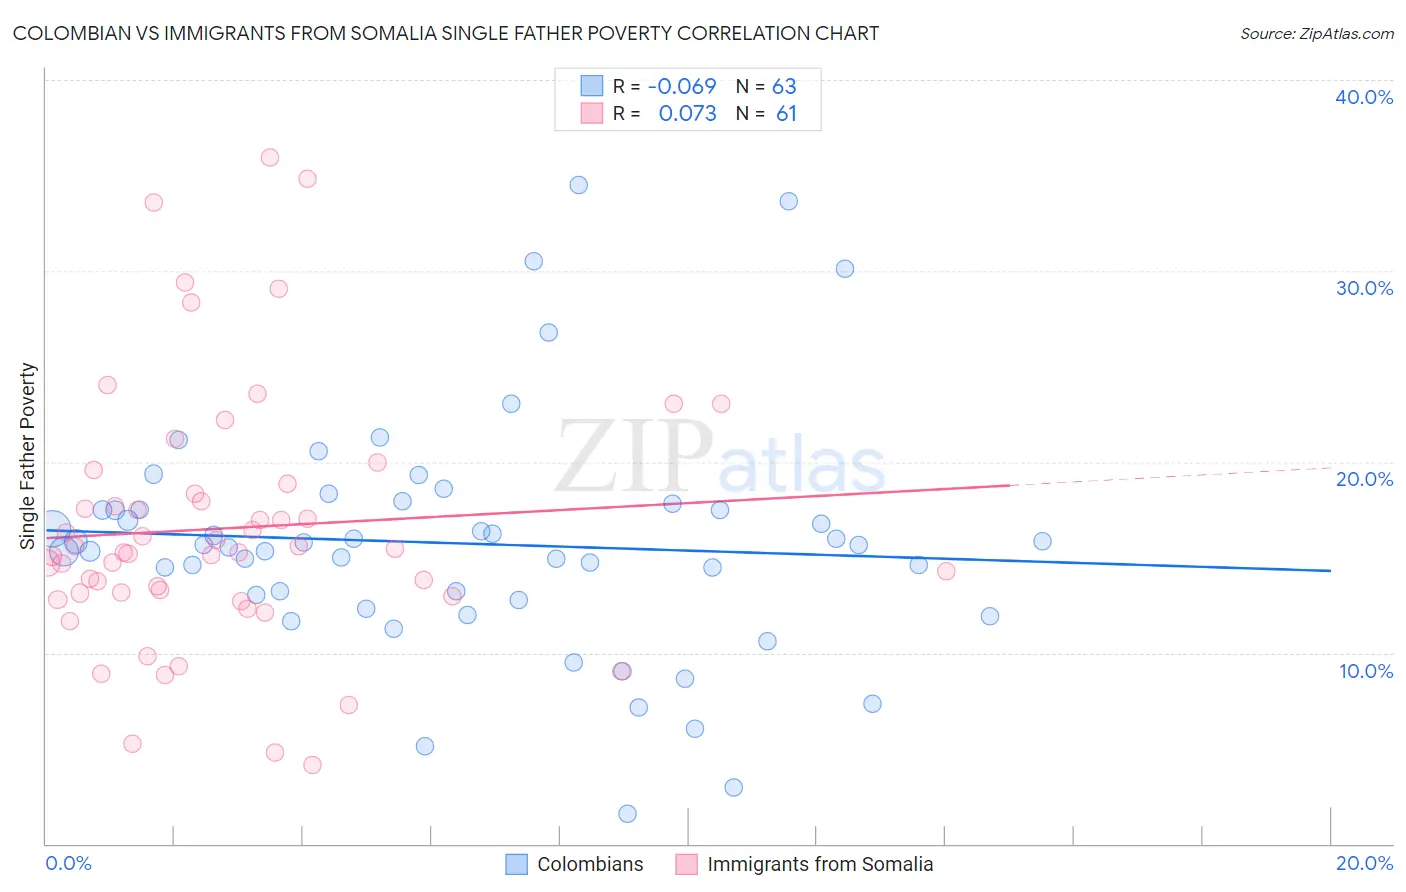
Colombian vs Immigrants from Somalia Single Father Poverty Correlation Chart

The statistical analysis conducted on geographies consisting of 329,050,963 people shows a slight negative correlation between the proportion of Colombians and poverty level among single fathers in the United States with a correlation coefficient (R) of -0.069 and weighted average of 16.1%. Similarly, the statistical analysis conducted on geographies consisting of 85,270,664 people shows a slight positive correlation between the proportion of Immigrants from Somalia and poverty level among single fathers in the United States with a correlation coefficient (R) of 0.073 and weighted average of 14.9%, a difference of 7.8%.
Colombian vs Immigrants from Somalia Single Father Poverty

Single Father Poverty Correlation Summary

MeasurementColombianImmigrants from Somalia
Minimum1.6%4.1%
Maximum34.5%35.9%
Range32.9%31.8%
Mean15.7%16.5%
Median15.6%15.3%
Interquartile 25% (IQ1)12.8%13.0%
Interquartile 75% (IQ3)17.5%18.6%
Interquartile Range (IQR)4.7%5.6%
Standard Deviation (Sample)6.2%6.7%
Standard Deviation (Population)6.2%6.7%

Similar Demographics by Single Father Poverty

Demographics Similar to Colombians by Single Father Poverty

In terms of single father poverty, the demographic groups most similar to Colombians are Nigerian (16.1%, a difference of 0.020%), Immigrants from Hungary (16.1%, a difference of 0.080%), South African (16.1%, a difference of 0.12%), Jordanian (16.1%, a difference of 0.18%), and Immigrants from Western Asia (16.0%, a difference of 0.24%).
DemographicsRating | RankSingle Father Poverty
Immigrants | Netherlands
85.3
/100
|
#140
Excellent
16.0%
Liberians
83.3
/100
|
#141
Excellent
16.0%
Immigrants | Mexico
83.3
/100
|
#142
Excellent
16.0%
Immigrants | Central America
83.1
/100
|
#143
Excellent
16.0%
Immigrants | Kuwait
81.4
/100
|
#144
Excellent
16.0%
Immigrants | Western Asia
80.7
/100
|
#145
Excellent
16.0%
Immigrants | Hungary
78.3
/100
|
#146
Good
16.1%
Colombians
77.1
/100
|
#147
Good
16.1%
Nigerians
76.8
/100
|
#148
Good
16.1%
South Africans
75.1
/100
|
#149
Good
16.1%
Jordanians
74.2
/100
|
#150
Good
16.1%
Immigrants | France
73.1
/100
|
#151
Good
16.1%
Immigrants | Zimbabwe
72.1
/100
|
#152
Good
16.1%
Immigrants | Israel
72.0
/100
|
#153
Good
16.1%
Mexicans
70.1
/100
|
#154
Good
16.1%

Demographics Similar to Immigrants from Somalia by Single Father Poverty

In terms of single father poverty, the demographic groups most similar to Immigrants from Somalia are Immigrants from Cambodia (14.9%, a difference of 0.12%), Immigrants from China (14.9%, a difference of 0.15%), Salvadoran (14.9%, a difference of 0.16%), Malaysian (14.9%, a difference of 0.16%), and Immigrants from Eastern Asia (15.0%, a difference of 0.31%).
DemographicsRating | RankSingle Father Poverty
Bolivians
100.0
/100
|
#38
Exceptional
14.7%
Immigrants | Asia
100.0
/100
|
#39
Exceptional
14.7%
Pima
100.0
/100
|
#40
Exceptional
14.8%
Indians (Asian)
100.0
/100
|
#41
Exceptional
14.8%
Immigrants | Nepal
100.0
/100
|
#42
Exceptional
14.8%
Immigrants | Eritrea
100.0
/100
|
#43
Exceptional
14.8%
Salvadorans
100.0
/100
|
#44
Exceptional
14.9%
Immigrants | Somalia
100.0
/100
|
#45
Exceptional
14.9%
Immigrants | Cambodia
99.9
/100
|
#46
Exceptional
14.9%
Immigrants | China
99.9
/100
|
#47
Exceptional
14.9%
Malaysians
99.9
/100
|
#48
Exceptional
14.9%
Immigrants | Eastern Asia
99.9
/100
|
#49
Exceptional
15.0%
Bhutanese
99.9
/100
|
#50
Exceptional
15.0%
Immigrants | Pakistan
99.9
/100
|
#51
Exceptional
15.0%
Immigrants | El Salvador
99.9
/100
|
#52
Exceptional
15.0%