Colombian vs Immigrants from Austria Male Poverty

COMPARE

Colombian
Race
Ancestry
AfghanAfricanAlaska NativeAlaskan AthabascanAlbanianAleutAlsatianAmericanApacheArabArapahoArgentineanArmenianAssyrian/Chaldean/SyriacAustralianAustrianBahamianBangladeshiBarbadianBasqueBelgianBelizeanBermudanBhutaneseBlackfeetBolivianBrazilianBritishBritish West IndianBulgarianBurmeseCajunCambodianCanadianCape VerdeanCarpatho RusynCelticCentral AmericanCentral American IndianCherokeeCheyenneChickasawChileanChineseChippewaChoctawColombianColvilleComancheCosta RicanCreeCreekCroatianCrowCubanCypriotCzechCzechoslovakianDanishDelawareDominicanDutchDutch West IndianEastern EuropeanEcuadorianEgyptianEnglishEstonianEthiopianEuropeanFijianFilipinoFinnishFrenchFrench American IndianFrench CanadianGermanGerman RussianGhanaianGreekGuamanian/ChamorroGuatemalanGuyaneseHaitianHmongHonduranHopiHoumaHungarianIcelanderIndian (Asian)IndonesianInupiatIranianIraqiIrishIroquoisIsraeliItalianJamaicanJapaneseJordanianKenyanKiowaKoreanLaotianLatvianLebaneseLiberianLithuanianLumbeeLuxembourgerMacedonianMalaysianMalteseMarshalleseMenomineeMexicanMexican American IndianMongolianMoroccanNative HawaiianNavajoNepaleseNew ZealanderNicaraguanNigerianNorthern EuropeanNorwegianOkinawanOsageOttawaPaiutePakistaniPalestinianPanamanianParaguayanPennsylvania GermanPeruvianPimaPolishPortuguesePotawatomiPuebloPuerto RicanPuget Sound SalishRomanianRussianSalvadoranSamoanScandinavianScotch-IrishScottishSeminoleSenegaleseSerbianShoshoneSierra LeoneanSiouxSlavicSlovakSloveneSomaliSouth AfricanSouth AmericanSouth American IndianSoviet UnionSpaniardSpanishSpanish AmericanSpanish American IndianSri LankanSubsaharan AfricanSudaneseSwedishSwissSyrianTaiwaneseThaiTlingit-HaidaTohono O'OdhamTonganTrinidadian and TobagonianTsimshianTurkishU.S. Virgin IslanderUgandanUkrainianUruguayanUteVenezuelanVietnameseWelshWest IndianYakamaYaquiYugoslavianYumanYup'ikZimbabwean
Immigration
NonimmigrantsImmigrantsAfghanistanAfricaAlbaniaArgentinaArmeniaAsiaAustraliaBahamasBangladeshBarbadosBelarusBelgiumBelizeBoliviaBosnia and HerzegovinaBrazilBulgariaBurma/MyanmarCabo VerdeCambodiaCameroonCanadaCaribbeanCentral AmericaChileChinaColombiaCongoCosta RicaCroatiaCubaCzechoslovakiaDenmarkDominicaDominican RepublicEastern AfricaEastern AsiaEastern EuropeEcuadorEgyptEl SalvadorEnglandEritreaEthiopiaEuropeFijiFranceGermanyGhanaGreeceGrenadaGuatemalaGuyanaHaitiHondurasHong KongHungaryIndiaIndonesiaIranIraqIrelandIsraelItalyJamaicaJapanJordanKazakhstanKenyaKoreaKuwaitLaosLatin AmericaLatviaLebanonLiberiaLithuaniaMalaysiaMexicoMicronesiaMiddle AfricaMoldovaMoroccoNepalNetherlandsNicaraguaNigeriaNorth AmericaNorth MacedoniaNorthern AfricaNorthern EuropeNorwayOceaniaPakistanPanamaPeruPhilippinesPolandPortugalRomaniaRussiaSaudi ArabiaScotlandSenegalSerbiaSierra LeoneSingaporeSomaliaSouth AfricaSouth AmericaSouth Central AsiaSouth Eastern AsiaSouthern EuropeSpainSri LankaSt. Vincent and the GrenadinesSudanSwedenSwitzerlandSyriaTaiwanThailandTrinidad and TobagoTurkeyUgandaUkraineUruguayUzbekistanVenezuelaVietnamWest IndiesWestern AfricaWestern AsiaWestern EuropeYemenZaireZimbabweAzores
Immigrants from Austria
Race
Ancestry
AfghanAfricanAlaska NativeAlaskan AthabascanAlbanianAleutAlsatianAmericanApacheArabArapahoArgentineanArmenianAssyrian/Chaldean/SyriacAustralianAustrianBahamianBangladeshiBarbadianBasqueBelgianBelizeanBermudanBhutaneseBlackfeetBolivianBrazilianBritishBritish West IndianBulgarianBurmeseCajunCambodianCanadianCape VerdeanCarpatho RusynCelticCentral AmericanCentral American IndianCherokeeCheyenneChickasawChileanChineseChippewaChoctawColvilleComancheCosta RicanCreeCreekCroatianCrowCubanCypriotCzechCzechoslovakianDanishDelawareDominicanDutchDutch West IndianEastern EuropeanEcuadorianEgyptianEnglishEstonianEthiopianEuropeanFijianFilipinoFinnishFrenchFrench American IndianFrench CanadianGermanGerman RussianGhanaianGreekGuamanian/ChamorroGuatemalanGuyaneseHaitianHmongHonduranHopiHoumaHungarianIcelanderIndian (Asian)IndonesianInupiatIranianIraqiIrishIroquoisIsraeliItalianJamaicanJapaneseJordanianKenyanKiowaKoreanLaotianLatvianLebaneseLiberianLithuanianLumbeeLuxembourgerMacedonianMalaysianMalteseMarshalleseMenomineeMexicanMexican American IndianMongolianMoroccanNative HawaiianNavajoNepaleseNew ZealanderNicaraguanNigerianNorthern EuropeanNorwegianOkinawanOsageOttawaPaiutePakistaniPalestinianPanamanianParaguayanPennsylvania GermanPeruvianPimaPolishPortuguesePotawatomiPuebloPuerto RicanPuget Sound SalishRomanianRussianSalvadoranSamoanScandinavianScotch-IrishScottishSeminoleSenegaleseSerbianShoshoneSierra LeoneanSiouxSlavicSlovakSloveneSomaliSouth AfricanSouth AmericanSouth American IndianSoviet UnionSpaniardSpanishSpanish AmericanSpanish American IndianSri LankanSubsaharan AfricanSudaneseSwedishSwissSyrianTaiwaneseThaiTlingit-HaidaTohono O'OdhamTonganTrinidadian and TobagonianTsimshianTurkishU.S. Virgin IslanderUgandanUkrainianUruguayanUteVenezuelanVietnameseWelshWest IndianYakamaYaquiYugoslavianYumanYup'ikZimbabwean
Immigration
NonimmigrantsImmigrantsAfghanistanAfricaAlbaniaArgentinaArmeniaAsiaAustraliaAustriaBahamasBangladeshBarbadosBelarusBelgiumBelizeBoliviaBosnia and HerzegovinaBrazilBulgariaBurma/MyanmarCabo VerdeCambodiaCameroonCanadaCaribbeanCentral AmericaChileChinaColombiaCongoCosta RicaCroatiaCubaCzechoslovakiaDenmarkDominicaDominican RepublicEastern AfricaEastern AsiaEastern EuropeEcuadorEgyptEl SalvadorEnglandEritreaEthiopiaEuropeFijiFranceGermanyGhanaGreeceGrenadaGuatemalaGuyanaHaitiHondurasHong KongHungaryIndiaIndonesiaIranIraqIrelandIsraelItalyJamaicaJapanJordanKazakhstanKenyaKoreaKuwaitLaosLatin AmericaLatviaLebanonLiberiaLithuaniaMalaysiaMexicoMicronesiaMiddle AfricaMoldovaMoroccoNepalNetherlandsNicaraguaNigeriaNorth AmericaNorth MacedoniaNorthern AfricaNorthern EuropeNorwayOceaniaPakistanPanamaPeruPhilippinesPolandPortugalRomaniaRussiaSaudi ArabiaScotlandSenegalSerbiaSierra LeoneSingaporeSomaliaSouth AfricaSouth AmericaSouth Central AsiaSouth Eastern AsiaSouthern EuropeSpainSri LankaSt. Vincent and the GrenadinesSudanSwedenSwitzerlandSyriaTaiwanThailandTrinidad and TobagoTurkeyUgandaUkraineUruguayUzbekistanVenezuelaVietnamWest IndiesWestern AfricaWestern AsiaWestern EuropeYemenZaireZimbabweAzores
Male Poverty
Income
Poverty
Unemployment
Labor Participation
Family Structure
Vehicle Availability
Education Level
Disability

Male Poverty Comparison

Colombians

Immigrants from Austria

Good
Exceptional
11.0%
MALE POVERTY
63.0/ 100
METRIC RATING
158th/ 347
METRIC RANK
10.0%
MALE POVERTY
98.5/ 100
METRIC RATING
54th/ 347
METRIC RANK

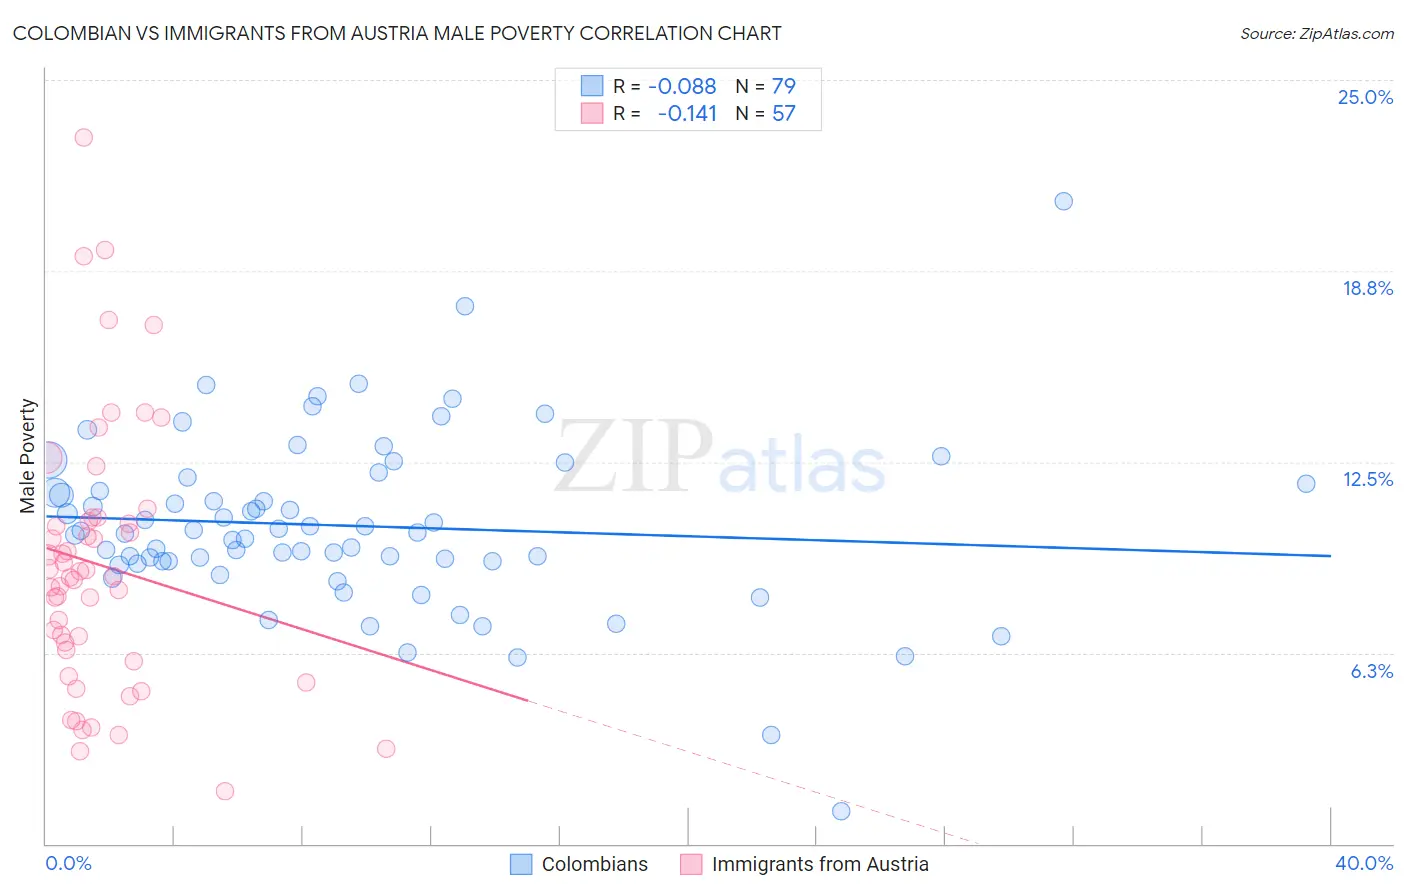
Colombian vs Immigrants from Austria Male Poverty Correlation Chart

The statistical analysis conducted on geographies consisting of 419,146,336 people shows a slight negative correlation between the proportion of Colombians and poverty level among males in the United States with a correlation coefficient (R) of -0.088 and weighted average of 11.0%. Similarly, the statistical analysis conducted on geographies consisting of 167,922,169 people shows a poor negative correlation between the proportion of Immigrants from Austria and poverty level among males in the United States with a correlation coefficient (R) of -0.141 and weighted average of 10.0%, a difference of 9.9%.
Colombian vs Immigrants from Austria Male Poverty

Male Poverty Correlation Summary

MeasurementColombianImmigrants from Austria
Minimum1.0%1.7%
Maximum21.0%23.1%
Range20.0%21.4%
Mean10.4%9.1%
Median10.2%8.7%
Interquartile 25% (IQ1)9.2%6.2%
Interquartile 75% (IQ3)11.8%10.6%
Interquartile Range (IQR)2.5%4.5%
Standard Deviation (Sample)2.9%4.4%
Standard Deviation (Population)2.9%4.3%

Similar Demographics by Male Poverty

Demographics Similar to Colombians by Male Poverty

In terms of male poverty, the demographic groups most similar to Colombians are Taiwanese (11.0%, a difference of 0.030%), Scotch-Irish (11.0%, a difference of 0.080%), Costa Rican (11.0%, a difference of 0.10%), Immigrants from Malaysia (11.0%, a difference of 0.19%), and Immigrants from Kazakhstan (11.0%, a difference of 0.20%).
DemographicsRating | RankMale Poverty
Venezuelans
67.4
/100
|
#151
Good
11.0%
Immigrants | Nepal
67.3
/100
|
#152
Good
11.0%
Immigrants | Bosnia and Herzegovina
65.2
/100
|
#153
Good
11.0%
Immigrants | Kazakhstan
64.8
/100
|
#154
Good
11.0%
Immigrants | Malaysia
64.7
/100
|
#155
Good
11.0%
Costa Ricans
63.9
/100
|
#156
Good
11.0%
Scotch-Irish
63.7
/100
|
#157
Good
11.0%
Colombians
63.0
/100
|
#158
Good
11.0%
Taiwanese
62.7
/100
|
#159
Good
11.0%
Soviet Union
60.3
/100
|
#160
Good
11.1%
Immigrants | Northern Africa
59.7
/100
|
#161
Average
11.1%
Immigrants | Chile
57.4
/100
|
#162
Average
11.1%
Whites/Caucasians
56.7
/100
|
#163
Average
11.1%
Ethiopians
56.7
/100
|
#164
Average
11.1%
Immigrants | Spain
55.5
/100
|
#165
Average
11.1%

Demographics Similar to Immigrants from Austria by Male Poverty

In terms of male poverty, the demographic groups most similar to Immigrants from Austria are Immigrants from Czechoslovakia (10.0%, a difference of 0.28%), German (10.1%, a difference of 0.29%), Asian (10.0%, a difference of 0.35%), Immigrants from Croatia (10.0%, a difference of 0.44%), and Immigrants from Bulgaria (10.1%, a difference of 0.50%).
DemographicsRating | RankMale Poverty
Immigrants | Singapore
98.8
/100
|
#47
Exceptional
10.0%
Immigrants | Japan
98.8
/100
|
#48
Exceptional
10.0%
Slovenes
98.8
/100
|
#49
Exceptional
10.0%
Immigrants | Philippines
98.7
/100
|
#50
Exceptional
10.0%
Immigrants | Croatia
98.7
/100
|
#51
Exceptional
10.0%
Asians
98.7
/100
|
#52
Exceptional
10.0%
Immigrants | Czechoslovakia
98.6
/100
|
#53
Exceptional
10.0%
Immigrants | Austria
98.5
/100
|
#54
Exceptional
10.0%
Germans
98.3
/100
|
#55
Exceptional
10.1%
Immigrants | Bulgaria
98.2
/100
|
#56
Exceptional
10.1%
Estonians
98.1
/100
|
#57
Exceptional
10.1%
Scandinavians
98.0
/100
|
#58
Exceptional
10.1%
Immigrants | Europe
97.9
/100
|
#59
Exceptional
10.1%
Ukrainians
97.9
/100
|
#60
Exceptional
10.1%
Austrians
97.8
/100
|
#61
Exceptional
10.1%