Colombian vs Immigrants from Argentina Female Poverty

COMPARE

Colombian
Race
Ancestry
AfghanAfricanAlaska NativeAlaskan AthabascanAlbanianAleutAlsatianAmericanApacheArabArapahoArgentineanArmenianAssyrian/Chaldean/SyriacAustralianAustrianBahamianBangladeshiBarbadianBasqueBelgianBelizeanBermudanBhutaneseBlackfeetBolivianBrazilianBritishBritish West IndianBulgarianBurmeseCajunCambodianCanadianCape VerdeanCarpatho RusynCelticCentral AmericanCentral American IndianCherokeeCheyenneChickasawChileanChineseChippewaChoctawColombianColvilleComancheCosta RicanCreeCreekCroatianCrowCubanCypriotCzechCzechoslovakianDanishDelawareDominicanDutchDutch West IndianEastern EuropeanEcuadorianEgyptianEnglishEstonianEthiopianEuropeanFijianFilipinoFinnishFrenchFrench American IndianFrench CanadianGermanGerman RussianGhanaianGreekGuamanian/ChamorroGuatemalanGuyaneseHaitianHmongHonduranHopiHoumaHungarianIcelanderIndian (Asian)IndonesianInupiatIranianIraqiIrishIroquoisIsraeliItalianJamaicanJapaneseJordanianKenyanKiowaKoreanLaotianLatvianLebaneseLiberianLithuanianLumbeeLuxembourgerMacedonianMalaysianMalteseMarshalleseMenomineeMexicanMexican American IndianMongolianMoroccanNative HawaiianNavajoNepaleseNew ZealanderNicaraguanNigerianNorthern EuropeanNorwegianOkinawanOsageOttawaPaiutePakistaniPalestinianPanamanianParaguayanPennsylvania GermanPeruvianPimaPolishPortuguesePotawatomiPuebloPuerto RicanPuget Sound SalishRomanianRussianSalvadoranSamoanScandinavianScotch-IrishScottishSeminoleSenegaleseSerbianShoshoneSierra LeoneanSiouxSlavicSlovakSloveneSomaliSouth AfricanSouth AmericanSouth American IndianSoviet UnionSpaniardSpanishSpanish AmericanSpanish American IndianSri LankanSubsaharan AfricanSudaneseSwedishSwissSyrianTaiwaneseThaiTlingit-HaidaTohono O'OdhamTonganTrinidadian and TobagonianTsimshianTurkishU.S. Virgin IslanderUgandanUkrainianUruguayanUteVenezuelanVietnameseWelshWest IndianYakamaYaquiYugoslavianYumanYup'ikZimbabwean
Immigration
NonimmigrantsImmigrantsAfghanistanAfricaAlbaniaArmeniaAsiaAustraliaAustriaBahamasBangladeshBarbadosBelarusBelgiumBelizeBoliviaBosnia and HerzegovinaBrazilBulgariaBurma/MyanmarCabo VerdeCambodiaCameroonCanadaCaribbeanCentral AmericaChileChinaColombiaCongoCosta RicaCroatiaCubaCzechoslovakiaDenmarkDominicaDominican RepublicEastern AfricaEastern AsiaEastern EuropeEcuadorEgyptEl SalvadorEnglandEritreaEthiopiaEuropeFijiFranceGermanyGhanaGreeceGrenadaGuatemalaGuyanaHaitiHondurasHong KongHungaryIndiaIndonesiaIranIraqIrelandIsraelItalyJamaicaJapanJordanKazakhstanKenyaKoreaKuwaitLaosLatin AmericaLatviaLebanonLiberiaLithuaniaMalaysiaMexicoMicronesiaMiddle AfricaMoldovaMoroccoNepalNetherlandsNicaraguaNigeriaNorth AmericaNorth MacedoniaNorthern AfricaNorthern EuropeNorwayOceaniaPakistanPanamaPeruPhilippinesPolandPortugalRomaniaRussiaSaudi ArabiaScotlandSenegalSerbiaSierra LeoneSingaporeSomaliaSouth AfricaSouth AmericaSouth Central AsiaSouth Eastern AsiaSouthern EuropeSpainSri LankaSt. Vincent and the GrenadinesSudanSwedenSwitzerlandSyriaTaiwanThailandTrinidad and TobagoTurkeyUgandaUkraineUruguayUzbekistanVenezuelaVietnamWest IndiesWestern AfricaWestern AsiaWestern EuropeYemenZaireZimbabweAzores
Immigrants from Argentina
Race
Ancestry
AfghanAfricanAlaska NativeAlaskan AthabascanAlbanianAleutAlsatianAmericanApacheArabArapahoArgentineanArmenianAssyrian/Chaldean/SyriacAustralianAustrianBahamianBangladeshiBarbadianBasqueBelgianBelizeanBermudanBhutaneseBlackfeetBolivianBrazilianBritishBritish West IndianBulgarianBurmeseCajunCambodianCanadianCape VerdeanCarpatho RusynCelticCentral AmericanCentral American IndianCherokeeCheyenneChickasawChileanChineseChippewaChoctawColvilleComancheCosta RicanCreeCreekCroatianCrowCubanCypriotCzechCzechoslovakianDanishDelawareDominicanDutchDutch West IndianEastern EuropeanEcuadorianEgyptianEnglishEstonianEthiopianEuropeanFijianFilipinoFinnishFrenchFrench American IndianFrench CanadianGermanGerman RussianGhanaianGreekGuamanian/ChamorroGuatemalanGuyaneseHaitianHmongHonduranHopiHoumaHungarianIcelanderIndian (Asian)IndonesianInupiatIranianIraqiIrishIroquoisIsraeliItalianJamaicanJapaneseJordanianKenyanKiowaKoreanLaotianLatvianLebaneseLiberianLithuanianLumbeeLuxembourgerMacedonianMalaysianMalteseMarshalleseMenomineeMexicanMexican American IndianMongolianMoroccanNative HawaiianNavajoNepaleseNew ZealanderNicaraguanNigerianNorthern EuropeanNorwegianOkinawanOsageOttawaPaiutePakistaniPalestinianPanamanianParaguayanPennsylvania GermanPeruvianPimaPolishPortuguesePotawatomiPuebloPuerto RicanPuget Sound SalishRomanianRussianSalvadoranSamoanScandinavianScotch-IrishScottishSeminoleSenegaleseSerbianShoshoneSierra LeoneanSiouxSlavicSlovakSloveneSomaliSouth AfricanSouth AmericanSouth American IndianSoviet UnionSpaniardSpanishSpanish AmericanSpanish American IndianSri LankanSubsaharan AfricanSudaneseSwedishSwissSyrianTaiwaneseThaiTlingit-HaidaTohono O'OdhamTonganTrinidadian and TobagonianTsimshianTurkishU.S. Virgin IslanderUgandanUkrainianUruguayanUteVenezuelanVietnameseWelshWest IndianYakamaYaquiYugoslavianYumanYup'ikZimbabwean
Immigration
NonimmigrantsImmigrantsAfghanistanAfricaAlbaniaArgentinaArmeniaAsiaAustraliaAustriaBahamasBangladeshBarbadosBelarusBelgiumBelizeBoliviaBosnia and HerzegovinaBrazilBulgariaBurma/MyanmarCabo VerdeCambodiaCameroonCanadaCaribbeanCentral AmericaChileChinaColombiaCongoCosta RicaCroatiaCubaCzechoslovakiaDenmarkDominicaDominican RepublicEastern AfricaEastern AsiaEastern EuropeEcuadorEgyptEl SalvadorEnglandEritreaEthiopiaEuropeFijiFranceGermanyGhanaGreeceGrenadaGuatemalaGuyanaHaitiHondurasHong KongHungaryIndiaIndonesiaIranIraqIrelandIsraelItalyJamaicaJapanJordanKazakhstanKenyaKoreaKuwaitLaosLatin AmericaLatviaLebanonLiberiaLithuaniaMalaysiaMexicoMicronesiaMiddle AfricaMoldovaMoroccoNepalNetherlandsNicaraguaNigeriaNorth AmericaNorth MacedoniaNorthern AfricaNorthern EuropeNorwayOceaniaPakistanPanamaPeruPhilippinesPolandPortugalRomaniaRussiaSaudi ArabiaScotlandSenegalSerbiaSierra LeoneSingaporeSomaliaSouth AfricaSouth AmericaSouth Central AsiaSouth Eastern AsiaSouthern EuropeSpainSri LankaSt. Vincent and the GrenadinesSudanSwedenSwitzerlandSyriaTaiwanThailandTrinidad and TobagoTurkeyUgandaUkraineUruguayUzbekistanVenezuelaVietnamWest IndiesWestern AfricaWestern AsiaWestern EuropeYemenZaireZimbabweAzores
Female Poverty
Income
Poverty
Unemployment
Labor Participation
Family Structure
Vehicle Availability
Education Level
Disability

Female Poverty Comparison

Colombians

Immigrants from Argentina

Average
Excellent
13.4%
FEMALE POVERTY
55.7/ 100
METRIC RATING
170th/ 347
METRIC RANK
12.8%
FEMALE POVERTY
87.0/ 100
METRIC RATING
131st/ 347
METRIC RANK

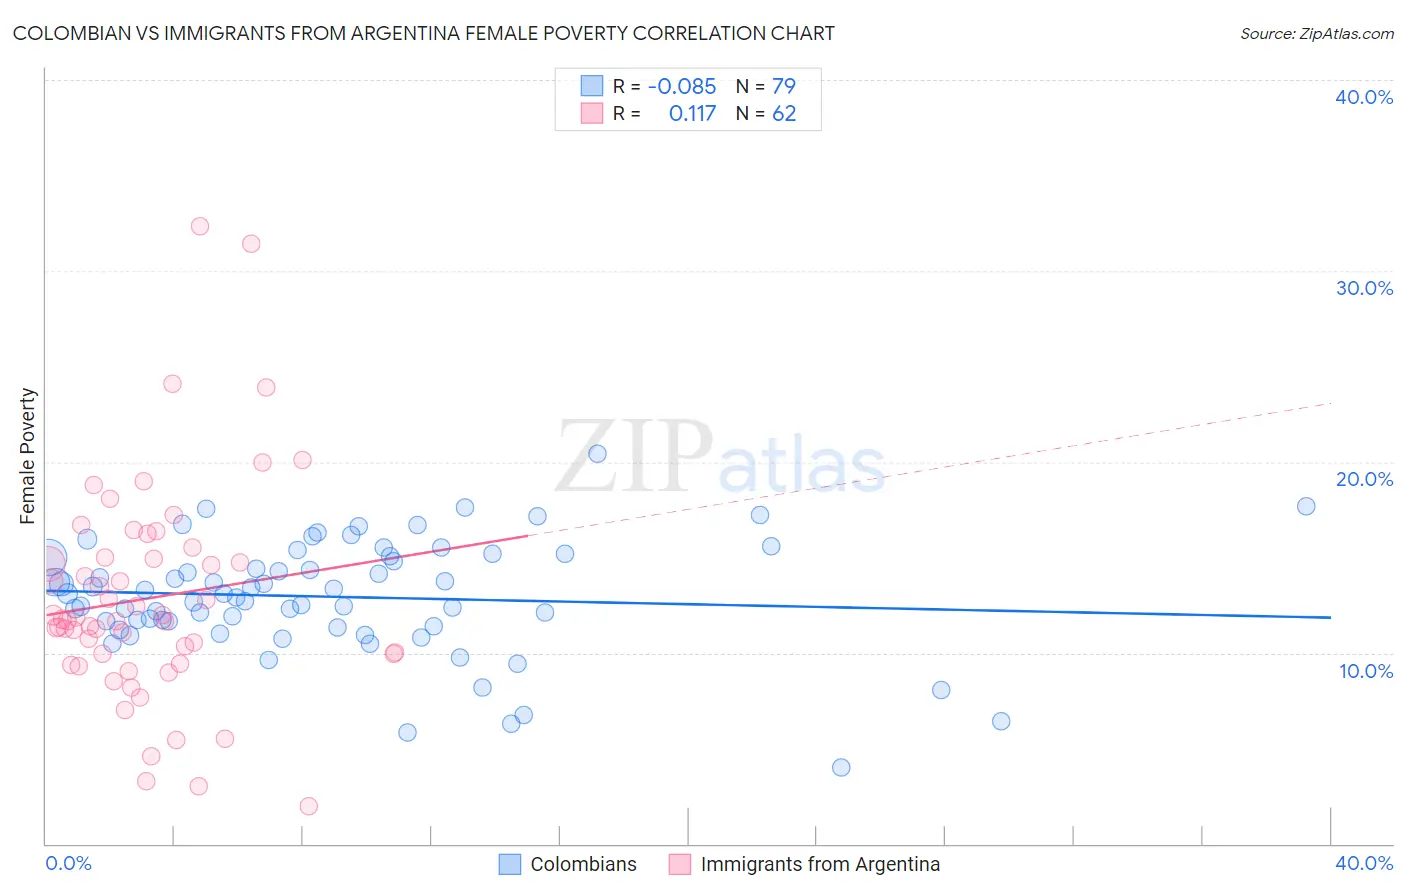
Colombian vs Immigrants from Argentina Female Poverty Correlation Chart

The statistical analysis conducted on geographies consisting of 419,235,280 people shows a slight negative correlation between the proportion of Colombians and poverty level among females in the United States with a correlation coefficient (R) of -0.085 and weighted average of 13.4%. Similarly, the statistical analysis conducted on geographies consisting of 264,332,384 people shows a poor positive correlation between the proportion of Immigrants from Argentina and poverty level among females in the United States with a correlation coefficient (R) of 0.117 and weighted average of 12.8%, a difference of 4.2%.
Colombian vs Immigrants from Argentina Female Poverty

Female Poverty Correlation Summary

MeasurementColombianImmigrants from Argentina
Minimum4.0%1.9%
Maximum20.5%32.3%
Range16.5%30.4%
Mean12.9%12.9%
Median13.1%11.7%
Interquartile 25% (IQ1)11.4%9.9%
Interquartile 75% (IQ3)15.1%15.0%
Interquartile Range (IQR)3.7%5.0%
Standard Deviation (Sample)3.0%5.7%
Standard Deviation (Population)3.0%5.7%

Similar Demographics by Female Poverty

Demographics Similar to Colombians by Female Poverty

In terms of female poverty, the demographic groups most similar to Colombians are Lebanese (13.4%, a difference of 0.020%), Aleut (13.4%, a difference of 0.10%), White/Caucasian (13.4%, a difference of 0.11%), Immigrants from Chile (13.3%, a difference of 0.16%), and Mongolian (13.4%, a difference of 0.21%).
DemographicsRating | RankFemale Poverty
Immigrants | Albania
62.4
/100
|
#163
Good
13.3%
Ethiopians
62.3
/100
|
#164
Good
13.3%
Scotch-Irish
62.1
/100
|
#165
Good
13.3%
Immigrants | Oceania
59.7
/100
|
#166
Average
13.3%
Immigrants | Chile
57.4
/100
|
#167
Average
13.3%
Aleuts
56.7
/100
|
#168
Average
13.4%
Lebanese
55.9
/100
|
#169
Average
13.4%
Colombians
55.7
/100
|
#170
Average
13.4%
Whites/Caucasians
54.6
/100
|
#171
Average
13.4%
Mongolians
53.6
/100
|
#172
Average
13.4%
Immigrants | Afghanistan
50.8
/100
|
#173
Average
13.4%
Immigrants | Iraq
50.0
/100
|
#174
Average
13.4%
Celtics
49.9
/100
|
#175
Average
13.4%
Immigrants | Spain
49.9
/100
|
#176
Average
13.4%
Immigrants | Morocco
49.4
/100
|
#177
Average
13.4%

Demographics Similar to Immigrants from Argentina by Female Poverty

In terms of female poverty, the demographic groups most similar to Immigrants from Argentina are Immigrants from Jordan (12.8%, a difference of 0.010%), Immigrants from Vietnam (12.8%, a difference of 0.030%), Immigrants from Western Europe (12.8%, a difference of 0.070%), Immigrants from Brazil (12.8%, a difference of 0.22%), and Immigrants from Switzerland (12.9%, a difference of 0.24%).
DemographicsRating | RankFemale Poverty
Immigrants | Norway
89.3
/100
|
#124
Excellent
12.8%
Argentineans
89.1
/100
|
#125
Excellent
12.8%
Immigrants | Ukraine
88.8
/100
|
#126
Excellent
12.8%
South Africans
88.4
/100
|
#127
Excellent
12.8%
Immigrants | Belarus
88.2
/100
|
#128
Excellent
12.8%
Immigrants | Brazil
87.9
/100
|
#129
Excellent
12.8%
Immigrants | Vietnam
87.1
/100
|
#130
Excellent
12.8%
Immigrants | Argentina
87.0
/100
|
#131
Excellent
12.8%
Immigrants | Jordan
86.9
/100
|
#132
Excellent
12.8%
Immigrants | Western Europe
86.6
/100
|
#133
Excellent
12.8%
Immigrants | Switzerland
85.8
/100
|
#134
Excellent
12.9%
French
85.6
/100
|
#135
Excellent
12.9%
Peruvians
85.2
/100
|
#136
Excellent
12.9%
Chileans
84.7
/100
|
#137
Excellent
12.9%
Immigrants | France
83.6
/100
|
#138
Excellent
12.9%