Choctaw vs Immigrants from Morocco Female Poverty Among 18-24 Year Olds

COMPARE

Choctaw
Race
Ancestry
AfghanAfricanAlaska NativeAlaskan AthabascanAlbanianAleutAlsatianAmericanApacheArabArapahoArgentineanArmenianAssyrian/Chaldean/SyriacAustralianAustrianBahamianBangladeshiBarbadianBasqueBelgianBelizeanBermudanBhutaneseBlackfeetBolivianBrazilianBritishBritish West IndianBulgarianBurmeseCajunCambodianCanadianCape VerdeanCarpatho RusynCelticCentral AmericanCentral American IndianCherokeeCheyenneChickasawChileanChineseChippewaChoctawColombianColvilleComancheCosta RicanCreeCreekCroatianCrowCubanCypriotCzechCzechoslovakianDanishDelawareDominicanDutchDutch West IndianEastern EuropeanEcuadorianEgyptianEnglishEstonianEthiopianEuropeanFijianFilipinoFinnishFrenchFrench American IndianFrench CanadianGermanGerman RussianGhanaianGreekGuamanian/ChamorroGuatemalanGuyaneseHaitianHmongHonduranHopiHoumaHungarianIcelanderIndian (Asian)IndonesianInupiatIranianIraqiIrishIroquoisIsraeliItalianJamaicanJapaneseJordanianKenyanKiowaKoreanLaotianLatvianLebaneseLiberianLithuanianLumbeeLuxembourgerMacedonianMalaysianMalteseMarshalleseMenomineeMexicanMexican American IndianMongolianMoroccanNative HawaiianNavajoNepaleseNew ZealanderNicaraguanNigerianNorthern EuropeanNorwegianOkinawanOsageOttawaPaiutePakistaniPalestinianPanamanianParaguayanPennsylvania GermanPeruvianPimaPolishPortuguesePotawatomiPuebloPuerto RicanPuget Sound SalishRomanianRussianSalvadoranSamoanScandinavianScotch-IrishScottishSeminoleSenegaleseSerbianShoshoneSierra LeoneanSiouxSlavicSlovakSloveneSomaliSouth AfricanSouth AmericanSouth American IndianSoviet UnionSpaniardSpanishSpanish AmericanSpanish American IndianSri LankanSubsaharan AfricanSudaneseSwedishSwissSyrianTaiwaneseThaiTlingit-HaidaTohono O'OdhamTonganTrinidadian and TobagonianTsimshianTurkishU.S. Virgin IslanderUgandanUkrainianUruguayanUteVenezuelanVietnameseWelshWest IndianYakamaYaquiYugoslavianYumanYup'ikZimbabwean
Immigration
NonimmigrantsImmigrantsAfghanistanAfricaAlbaniaArgentinaArmeniaAsiaAustraliaAustriaBahamasBangladeshBarbadosBelarusBelgiumBelizeBoliviaBosnia and HerzegovinaBrazilBulgariaBurma/MyanmarCabo VerdeCambodiaCameroonCanadaCaribbeanCentral AmericaChileChinaColombiaCongoCosta RicaCroatiaCubaCzechoslovakiaDenmarkDominicaDominican RepublicEastern AfricaEastern AsiaEastern EuropeEcuadorEgyptEl SalvadorEnglandEritreaEthiopiaEuropeFijiFranceGermanyGhanaGreeceGrenadaGuatemalaGuyanaHaitiHondurasHong KongHungaryIndiaIndonesiaIranIraqIrelandIsraelItalyJamaicaJapanJordanKazakhstanKenyaKoreaKuwaitLaosLatin AmericaLatviaLebanonLiberiaLithuaniaMalaysiaMexicoMicronesiaMiddle AfricaMoldovaNepalNetherlandsNicaraguaNigeriaNorth AmericaNorth MacedoniaNorthern AfricaNorthern EuropeNorwayOceaniaPakistanPanamaPeruPhilippinesPolandPortugalRomaniaRussiaSaudi ArabiaScotlandSenegalSerbiaSierra LeoneSingaporeSomaliaSouth AfricaSouth AmericaSouth Central AsiaSouth Eastern AsiaSouthern EuropeSpainSri LankaSt. Vincent and the GrenadinesSudanSwedenSwitzerlandSyriaTaiwanThailandTrinidad and TobagoTurkeyUgandaUkraineUruguayUzbekistanVenezuelaVietnamWest IndiesWestern AfricaWestern AsiaWestern EuropeYemenZaireZimbabweAzores
Immigrants from Morocco
Race
Ancestry
AfghanAfricanAlaska NativeAlaskan AthabascanAlbanianAleutAlsatianAmericanApacheArabArapahoArgentineanArmenianAssyrian/Chaldean/SyriacAustralianAustrianBahamianBangladeshiBarbadianBasqueBelgianBelizeanBermudanBhutaneseBlackfeetBolivianBrazilianBritishBritish West IndianBulgarianBurmeseCajunCambodianCanadianCape VerdeanCarpatho RusynCelticCentral AmericanCentral American IndianCherokeeCheyenneChickasawChileanChineseChippewaColombianColvilleComancheCosta RicanCreeCreekCroatianCrowCubanCypriotCzechCzechoslovakianDanishDelawareDominicanDutchDutch West IndianEastern EuropeanEcuadorianEgyptianEnglishEstonianEthiopianEuropeanFijianFilipinoFinnishFrenchFrench American IndianFrench CanadianGermanGerman RussianGhanaianGreekGuamanian/ChamorroGuatemalanGuyaneseHaitianHmongHonduranHopiHoumaHungarianIcelanderIndian (Asian)IndonesianInupiatIranianIraqiIrishIroquoisIsraeliItalianJamaicanJapaneseJordanianKenyanKiowaKoreanLaotianLatvianLebaneseLiberianLithuanianLumbeeLuxembourgerMacedonianMalaysianMalteseMarshalleseMenomineeMexicanMexican American IndianMongolianMoroccanNative HawaiianNavajoNepaleseNew ZealanderNicaraguanNigerianNorthern EuropeanNorwegianOkinawanOsageOttawaPaiutePakistaniPalestinianPanamanianParaguayanPennsylvania GermanPeruvianPimaPolishPortuguesePotawatomiPuebloPuerto RicanPuget Sound SalishRomanianRussianSalvadoranSamoanScandinavianScotch-IrishScottishSeminoleSenegaleseSerbianShoshoneSierra LeoneanSiouxSlavicSlovakSloveneSomaliSouth AfricanSouth AmericanSouth American IndianSoviet UnionSpaniardSpanishSpanish AmericanSpanish American IndianSri LankanSubsaharan AfricanSudaneseSwedishSwissSyrianTaiwaneseThaiTlingit-HaidaTohono O'OdhamTonganTrinidadian and TobagonianTsimshianTurkishU.S. Virgin IslanderUgandanUkrainianUruguayanUteVenezuelanVietnameseWelshWest IndianYakamaYaquiYugoslavianYumanYup'ikZimbabwean
Immigration
NonimmigrantsImmigrantsAfghanistanAfricaAlbaniaArgentinaArmeniaAsiaAustraliaAustriaBahamasBangladeshBarbadosBelarusBelgiumBelizeBoliviaBosnia and HerzegovinaBrazilBulgariaBurma/MyanmarCabo VerdeCambodiaCameroonCanadaCaribbeanCentral AmericaChileChinaColombiaCongoCosta RicaCroatiaCubaCzechoslovakiaDenmarkDominicaDominican RepublicEastern AfricaEastern AsiaEastern EuropeEcuadorEgyptEl SalvadorEnglandEritreaEthiopiaEuropeFijiFranceGermanyGhanaGreeceGrenadaGuatemalaGuyanaHaitiHondurasHong KongHungaryIndiaIndonesiaIranIraqIrelandIsraelItalyJamaicaJapanJordanKazakhstanKenyaKoreaKuwaitLaosLatin AmericaLatviaLebanonLiberiaLithuaniaMalaysiaMexicoMicronesiaMiddle AfricaMoldovaMoroccoNepalNetherlandsNicaraguaNigeriaNorth AmericaNorth MacedoniaNorthern AfricaNorthern EuropeNorwayOceaniaPakistanPanamaPeruPhilippinesPolandPortugalRomaniaRussiaSaudi ArabiaScotlandSenegalSerbiaSierra LeoneSingaporeSomaliaSouth AfricaSouth AmericaSouth Central AsiaSouth Eastern AsiaSouthern EuropeSpainSri LankaSt. Vincent and the GrenadinesSudanSwedenSwitzerlandSyriaTaiwanThailandTrinidad and TobagoTurkeyUgandaUkraineUruguayUzbekistanVenezuelaVietnamWest IndiesWestern AfricaWestern AsiaWestern EuropeYemenZaireZimbabweAzores
Female Poverty Among 18-24 Year Olds
Income
Poverty
Unemployment
Labor Participation
Family Structure
Vehicle Availability
Education Level
Disability

Female Poverty Among 18-24 Year Olds Comparison

Choctaw

Immigrants from Morocco

Tragic
Excellent
24.3%
FEMALE POVERTY AMONG 18-24 YEAR OLDS
0.0/ 100
METRIC RATING
314th/ 347
METRIC RANK
19.6%
FEMALE POVERTY AMONG 18-24 YEAR OLDS
89.9/ 100
METRIC RATING
138th/ 347
METRIC RANK

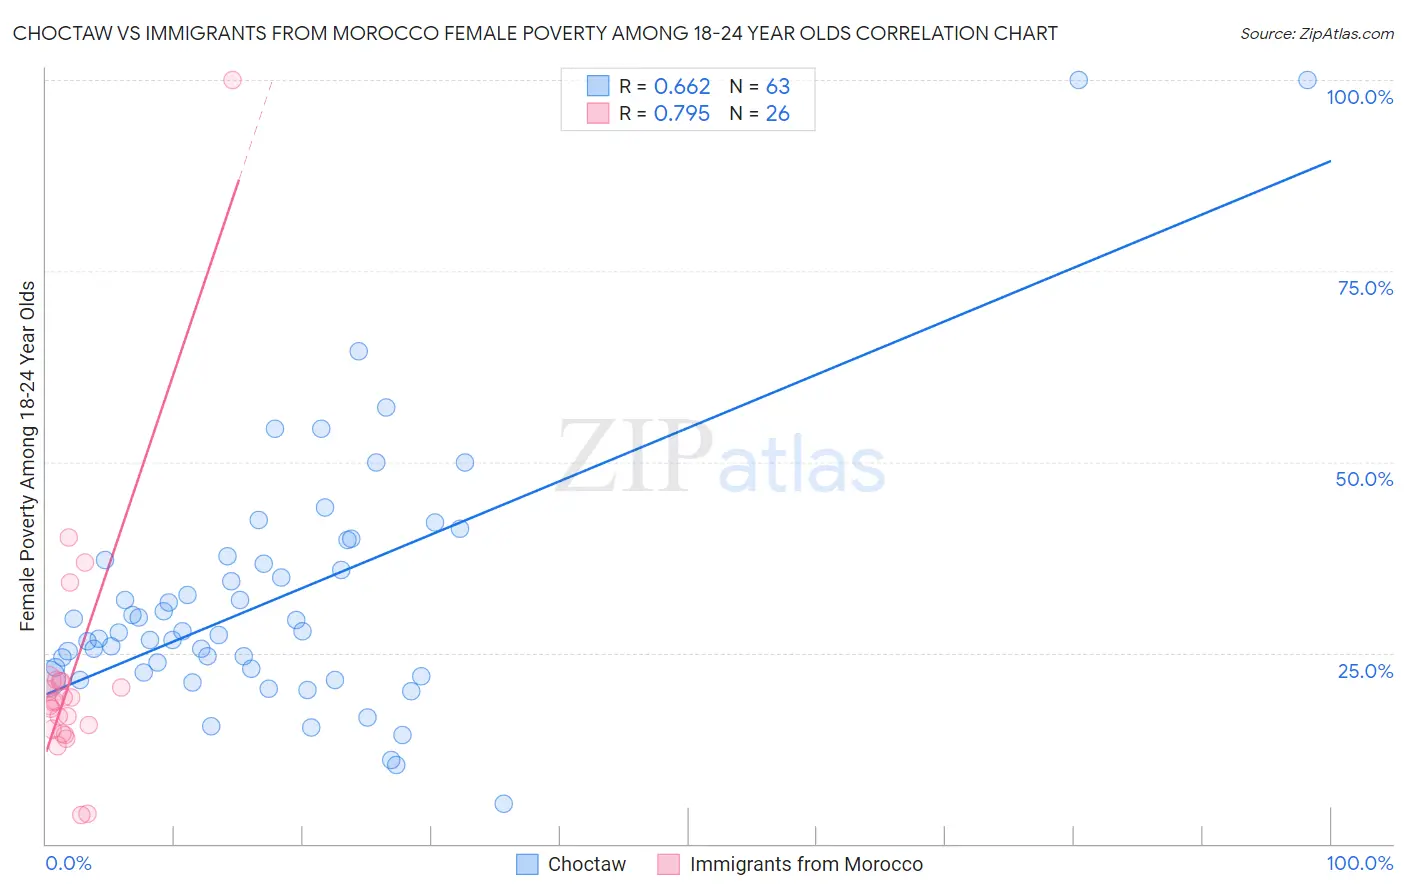
Choctaw vs Immigrants from Morocco Female Poverty Among 18-24 Year Olds Correlation Chart

The statistical analysis conducted on geographies consisting of 265,726,107 people shows a significant positive correlation between the proportion of Choctaw and poverty level among females between the ages 18 and 24 in the United States with a correlation coefficient (R) of 0.662 and weighted average of 24.3%. Similarly, the statistical analysis conducted on geographies consisting of 177,422,891 people shows a strong positive correlation between the proportion of Immigrants from Morocco and poverty level among females between the ages 18 and 24 in the United States with a correlation coefficient (R) of 0.795 and weighted average of 19.6%, a difference of 24.0%.
Choctaw vs Immigrants from Morocco Female Poverty Among 18-24 Year Olds

Female Poverty Among 18-24 Year Olds Correlation Summary

MeasurementChoctawImmigrants from Morocco
Minimum5.3%3.8%
Maximum100.0%100.0%
Range94.7%96.2%
Mean32.0%22.1%
Median27.7%18.6%
Interquartile 25% (IQ1)22.4%15.0%
Interquartile 75% (IQ3)37.2%21.4%
Interquartile Range (IQR)14.8%6.4%
Standard Deviation (Sample)17.0%17.8%
Standard Deviation (Population)16.8%17.5%

Similar Demographics by Female Poverty Among 18-24 Year Olds

Demographics Similar to Choctaw by Female Poverty Among 18-24 Year Olds

In terms of female poverty among 18-24 year olds, the demographic groups most similar to Choctaw are Creek (24.2%, a difference of 0.16%), Black/African American (24.3%, a difference of 0.20%), Alsatian (24.4%, a difference of 0.51%), Osage (24.5%, a difference of 0.81%), and Chickasaw (24.5%, a difference of 0.89%).
DemographicsRating | RankFemale Poverty Among 18-24 Year Olds
Cree
0.0
/100
|
#307
Tragic
23.4%
Immigrants | Sudan
0.0
/100
|
#308
Tragic
23.5%
Blackfeet
0.0
/100
|
#309
Tragic
23.6%
Comanche
0.0
/100
|
#310
Tragic
23.6%
Potawatomi
0.0
/100
|
#311
Tragic
23.7%
Yuman
0.0
/100
|
#312
Tragic
24.0%
Creek
0.0
/100
|
#313
Tragic
24.2%
Choctaw
0.0
/100
|
#314
Tragic
24.3%
Blacks/African Americans
0.0
/100
|
#315
Tragic
24.3%
Alsatians
0.0
/100
|
#316
Tragic
24.4%
Osage
0.0
/100
|
#317
Tragic
24.5%
Chickasaw
0.0
/100
|
#318
Tragic
24.5%
Dutch West Indians
0.0
/100
|
#319
Tragic
24.5%
Immigrants | Congo
0.0
/100
|
#320
Tragic
24.6%
Immigrants | Zaire
0.0
/100
|
#321
Tragic
25.1%

Demographics Similar to Immigrants from Morocco by Female Poverty Among 18-24 Year Olds

In terms of female poverty among 18-24 year olds, the demographic groups most similar to Immigrants from Morocco are Austrian (19.5%, a difference of 0.12%), Indian (Asian) (19.6%, a difference of 0.20%), Russian (19.5%, a difference of 0.24%), Soviet Union (19.5%, a difference of 0.33%), and Jamaican (19.5%, a difference of 0.35%).
DemographicsRating | RankFemale Poverty Among 18-24 Year Olds
Latvians
92.7
/100
|
#131
Exceptional
19.5%
Jamaicans
92.1
/100
|
#132
Exceptional
19.5%
Turks
92.1
/100
|
#133
Exceptional
19.5%
Immigrants | North America
92.1
/100
|
#134
Exceptional
19.5%
Soviet Union
92.0
/100
|
#135
Exceptional
19.5%
Russians
91.5
/100
|
#136
Exceptional
19.5%
Austrians
90.7
/100
|
#137
Exceptional
19.5%
Immigrants | Morocco
89.9
/100
|
#138
Excellent
19.6%
Indians (Asian)
88.3
/100
|
#139
Excellent
19.6%
Immigrants | Trinidad and Tobago
85.6
/100
|
#140
Excellent
19.7%
Pennsylvania Germans
85.5
/100
|
#141
Excellent
19.7%
Panamanians
84.6
/100
|
#142
Excellent
19.7%
Slavs
84.4
/100
|
#143
Excellent
19.7%
Immigrants | Northern Africa
84.1
/100
|
#144
Excellent
19.7%
Canadians
83.8
/100
|
#145
Excellent
19.7%