Choctaw vs Immigrants from Afghanistan Single Father Poverty

COMPARE

Choctaw
Race
Ancestry
AfghanAfricanAlaska NativeAlaskan AthabascanAlbanianAleutAlsatianAmericanApacheArabArapahoArgentineanArmenianAssyrian/Chaldean/SyriacAustralianAustrianBahamianBangladeshiBarbadianBasqueBelgianBelizeanBermudanBhutaneseBlackfeetBolivianBrazilianBritishBritish West IndianBulgarianBurmeseCajunCambodianCanadianCape VerdeanCarpatho RusynCelticCentral AmericanCentral American IndianCherokeeCheyenneChickasawChileanChineseChippewaChoctawColombianColvilleComancheCosta RicanCreeCreekCroatianCrowCubanCypriotCzechCzechoslovakianDanishDelawareDominicanDutchDutch West IndianEastern EuropeanEcuadorianEgyptianEnglishEstonianEthiopianEuropeanFijianFilipinoFinnishFrenchFrench American IndianFrench CanadianGermanGerman RussianGhanaianGreekGuamanian/ChamorroGuatemalanGuyaneseHaitianHmongHonduranHopiHoumaHungarianIcelanderIndian (Asian)IndonesianInupiatIranianIraqiIrishIroquoisIsraeliItalianJamaicanJapaneseJordanianKenyanKiowaKoreanLaotianLatvianLebaneseLiberianLithuanianLumbeeLuxembourgerMacedonianMalaysianMalteseMarshalleseMenomineeMexicanMexican American IndianMongolianMoroccanNative HawaiianNavajoNepaleseNew ZealanderNicaraguanNigerianNorthern EuropeanNorwegianOkinawanOsageOttawaPaiutePakistaniPalestinianPanamanianParaguayanPennsylvania GermanPeruvianPimaPolishPortuguesePotawatomiPuebloPuerto RicanPuget Sound SalishRomanianRussianSalvadoranSamoanScandinavianScotch-IrishScottishSeminoleSenegaleseSerbianShoshoneSierra LeoneanSiouxSlavicSlovakSloveneSomaliSouth AfricanSouth AmericanSouth American IndianSoviet UnionSpaniardSpanishSpanish AmericanSpanish American IndianSri LankanSubsaharan AfricanSudaneseSwedishSwissSyrianTaiwaneseThaiTlingit-HaidaTohono O'OdhamTonganTrinidadian and TobagonianTsimshianTurkishU.S. Virgin IslanderUgandanUkrainianUruguayanUteVenezuelanVietnameseWelshWest IndianYakamaYaquiYugoslavianYumanYup'ikZimbabwean
Immigration
NonimmigrantsImmigrantsAfricaAlbaniaArgentinaArmeniaAsiaAustraliaAustriaBahamasBangladeshBarbadosBelarusBelgiumBelizeBoliviaBosnia and HerzegovinaBrazilBulgariaBurma/MyanmarCabo VerdeCambodiaCameroonCanadaCaribbeanCentral AmericaChileChinaColombiaCongoCosta RicaCroatiaCubaCzechoslovakiaDenmarkDominicaDominican RepublicEastern AfricaEastern AsiaEastern EuropeEcuadorEgyptEl SalvadorEnglandEritreaEthiopiaEuropeFijiFranceGermanyGhanaGreeceGrenadaGuatemalaGuyanaHaitiHondurasHong KongHungaryIndiaIndonesiaIranIraqIrelandIsraelItalyJamaicaJapanJordanKazakhstanKenyaKoreaKuwaitLaosLatin AmericaLatviaLebanonLiberiaLithuaniaMalaysiaMexicoMicronesiaMiddle AfricaMoldovaMoroccoNepalNetherlandsNicaraguaNigeriaNorth AmericaNorth MacedoniaNorthern AfricaNorthern EuropeNorwayOceaniaPakistanPanamaPeruPhilippinesPolandPortugalRomaniaRussiaSaudi ArabiaScotlandSenegalSerbiaSierra LeoneSingaporeSomaliaSouth AfricaSouth AmericaSouth Central AsiaSouth Eastern AsiaSouthern EuropeSpainSri LankaSt. Vincent and the GrenadinesSudanSwedenSwitzerlandSyriaTaiwanThailandTrinidad and TobagoTurkeyUgandaUkraineUruguayUzbekistanVenezuelaVietnamWest IndiesWestern AfricaWestern AsiaWestern EuropeYemenZaireZimbabweAzores
Immigrants from Afghanistan
Race
Ancestry
AfghanAfricanAlaska NativeAlaskan AthabascanAlbanianAleutAlsatianAmericanApacheArabArapahoArgentineanArmenianAssyrian/Chaldean/SyriacAustralianAustrianBahamianBangladeshiBarbadianBasqueBelgianBelizeanBermudanBhutaneseBlackfeetBolivianBrazilianBritishBritish West IndianBulgarianBurmeseCajunCambodianCanadianCape VerdeanCarpatho RusynCelticCentral AmericanCentral American IndianCherokeeCheyenneChickasawChileanChineseChippewaColombianColvilleComancheCosta RicanCreeCreekCroatianCrowCubanCypriotCzechCzechoslovakianDanishDelawareDominicanDutchDutch West IndianEastern EuropeanEcuadorianEgyptianEnglishEstonianEthiopianEuropeanFijianFilipinoFinnishFrenchFrench American IndianFrench CanadianGermanGerman RussianGhanaianGreekGuamanian/ChamorroGuatemalanGuyaneseHaitianHmongHonduranHopiHoumaHungarianIcelanderIndian (Asian)IndonesianInupiatIranianIraqiIrishIroquoisIsraeliItalianJamaicanJapaneseJordanianKenyanKiowaKoreanLaotianLatvianLebaneseLiberianLithuanianLumbeeLuxembourgerMacedonianMalaysianMalteseMarshalleseMenomineeMexicanMexican American IndianMongolianMoroccanNative HawaiianNavajoNepaleseNew ZealanderNicaraguanNigerianNorthern EuropeanNorwegianOkinawanOsageOttawaPaiutePakistaniPalestinianPanamanianParaguayanPennsylvania GermanPeruvianPimaPolishPortuguesePotawatomiPuebloPuerto RicanPuget Sound SalishRomanianRussianSalvadoranSamoanScandinavianScotch-IrishScottishSeminoleSenegaleseSerbianShoshoneSierra LeoneanSiouxSlavicSlovakSloveneSomaliSouth AfricanSouth AmericanSouth American IndianSoviet UnionSpaniardSpanishSpanish AmericanSpanish American IndianSri LankanSubsaharan AfricanSudaneseSwedishSwissSyrianTaiwaneseThaiTlingit-HaidaTohono O'OdhamTonganTrinidadian and TobagonianTsimshianTurkishU.S. Virgin IslanderUgandanUkrainianUruguayanUteVenezuelanVietnameseWelshWest IndianYakamaYaquiYugoslavianYumanYup'ikZimbabwean
Immigration
NonimmigrantsImmigrantsAfghanistanAfricaAlbaniaArgentinaArmeniaAsiaAustraliaAustriaBahamasBangladeshBarbadosBelarusBelgiumBelizeBoliviaBosnia and HerzegovinaBrazilBulgariaBurma/MyanmarCabo VerdeCambodiaCameroonCanadaCaribbeanCentral AmericaChileChinaColombiaCongoCosta RicaCroatiaCubaCzechoslovakiaDenmarkDominicaDominican RepublicEastern AfricaEastern AsiaEastern EuropeEcuadorEgyptEl SalvadorEnglandEritreaEthiopiaEuropeFijiFranceGermanyGhanaGreeceGrenadaGuatemalaGuyanaHaitiHondurasHong KongHungaryIndiaIndonesiaIranIraqIrelandIsraelItalyJamaicaJapanJordanKazakhstanKenyaKoreaKuwaitLaosLatin AmericaLatviaLebanonLiberiaLithuaniaMalaysiaMexicoMicronesiaMiddle AfricaMoldovaMoroccoNepalNetherlandsNicaraguaNigeriaNorth AmericaNorth MacedoniaNorthern AfricaNorthern EuropeNorwayOceaniaPakistanPanamaPeruPhilippinesPolandPortugalRomaniaRussiaSaudi ArabiaScotlandSenegalSerbiaSierra LeoneSingaporeSomaliaSouth AfricaSouth AmericaSouth Central AsiaSouth Eastern AsiaSouthern EuropeSpainSri LankaSt. Vincent and the GrenadinesSudanSwedenSwitzerlandSyriaTaiwanThailandTrinidad and TobagoTurkeyUgandaUkraineUruguayUzbekistanVenezuelaVietnamWest IndiesWestern AfricaWestern AsiaWestern EuropeYemenZaireZimbabweAzores
Single Father Poverty
Income
Poverty
Unemployment
Labor Participation
Family Structure
Vehicle Availability
Education Level
Disability

Single Father Poverty Comparison

Choctaw

Immigrants from Afghanistan

Tragic
Exceptional
20.7%
SINGLE FATHER POVERTY
0.0/ 100
METRIC RATING
327th/ 347
METRIC RANK
14.3%
SINGLE FATHER POVERTY
100.0/ 100
METRIC RATING
21st/ 347
METRIC RANK

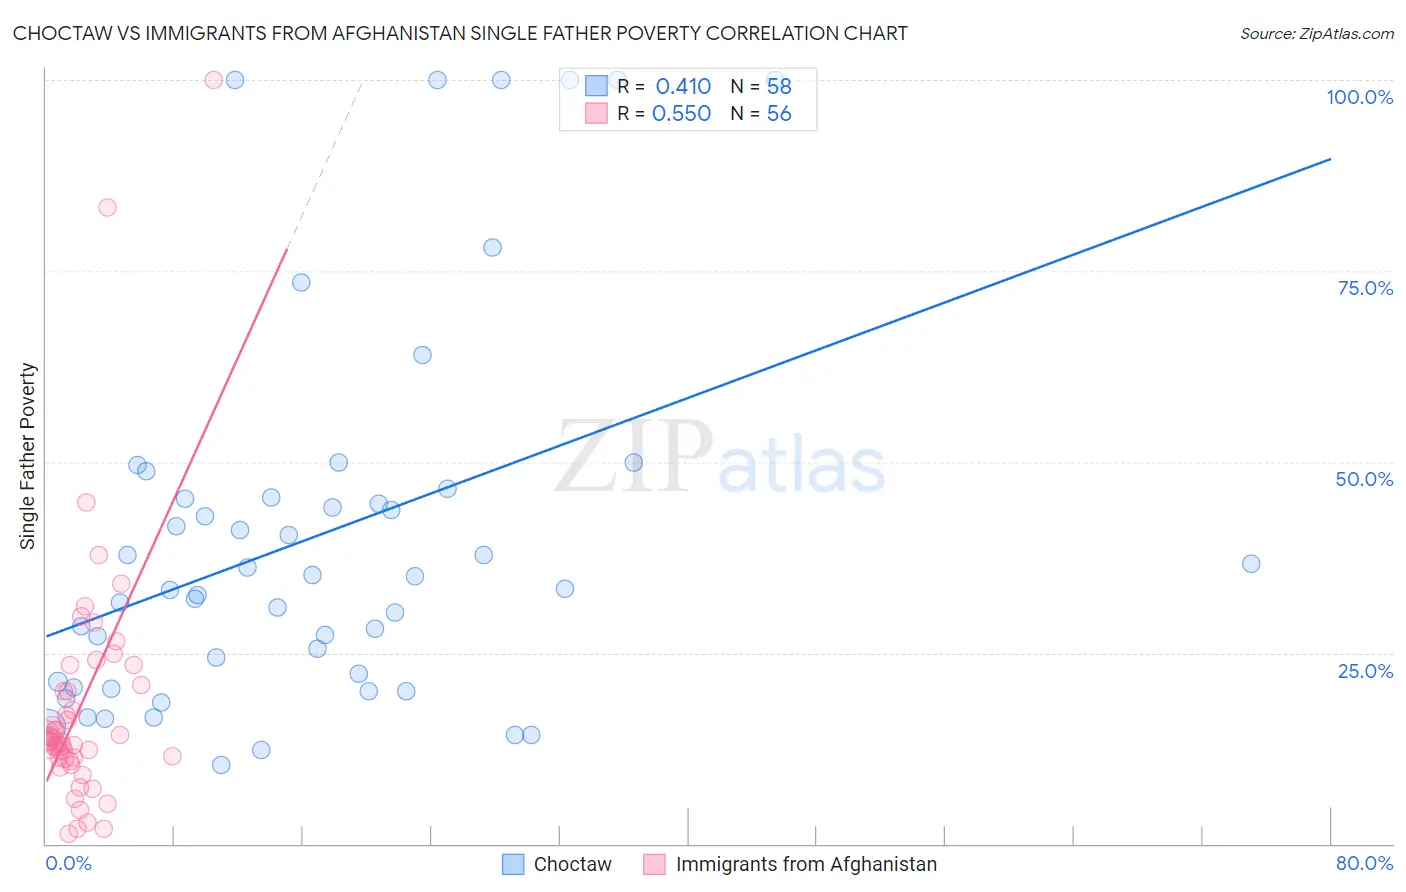
Choctaw vs Immigrants from Afghanistan Single Father Poverty Correlation Chart

The statistical analysis conducted on geographies consisting of 228,054,527 people shows a moderate positive correlation between the proportion of Choctaw and poverty level among single fathers in the United States with a correlation coefficient (R) of 0.410 and weighted average of 20.7%. Similarly, the statistical analysis conducted on geographies consisting of 129,306,719 people shows a substantial positive correlation between the proportion of Immigrants from Afghanistan and poverty level among single fathers in the United States with a correlation coefficient (R) of 0.550 and weighted average of 14.3%, a difference of 45.2%.
Choctaw vs Immigrants from Afghanistan Single Father Poverty

Single Father Poverty Correlation Summary

MeasurementChoctawImmigrants from Afghanistan
Minimum10.3%1.3%
Maximum100.0%100.0%
Range89.7%98.7%
Mean40.2%18.1%
Median34.2%13.4%
Interquartile 25% (IQ1)21.2%11.2%
Interquartile 75% (IQ3)45.3%20.4%
Interquartile Range (IQR)24.1%9.1%
Standard Deviation (Sample)24.9%16.9%
Standard Deviation (Population)24.7%16.7%

Similar Demographics by Single Father Poverty

Demographics Similar to Choctaw by Single Father Poverty

In terms of single father poverty, the demographic groups most similar to Choctaw are Immigrants from Yemen (20.6%, a difference of 0.69%), Black/African American (20.4%, a difference of 1.7%), Pueblo (21.1%, a difference of 1.9%), Colville (21.4%, a difference of 3.0%), and American (20.1%, a difference of 3.3%).
DemographicsRating | RankSingle Father Poverty
Inupiat
0.0
/100
|
#320
Tragic
19.5%
Cherokee
0.0
/100
|
#321
Tragic
19.6%
Creek
0.0
/100
|
#322
Tragic
19.8%
Pennsylvania Germans
0.0
/100
|
#323
Tragic
20.0%
Americans
0.0
/100
|
#324
Tragic
20.1%
Blacks/African Americans
0.0
/100
|
#325
Tragic
20.4%
Immigrants | Yemen
0.0
/100
|
#326
Tragic
20.6%
Choctaw
0.0
/100
|
#327
Tragic
20.7%
Pueblo
0.0
/100
|
#328
Tragic
21.1%
Colville
0.0
/100
|
#329
Tragic
21.4%
Paiute
0.0
/100
|
#330
Tragic
21.6%
Central American Indians
0.0
/100
|
#331
Tragic
21.7%
Tohono O'odham
0.0
/100
|
#332
Tragic
22.0%
Natives/Alaskans
0.0
/100
|
#333
Tragic
22.4%
Kiowa
0.0
/100
|
#334
Tragic
22.5%

Demographics Similar to Immigrants from Afghanistan by Single Father Poverty

In terms of single father poverty, the demographic groups most similar to Immigrants from Afghanistan are Immigrants from Singapore (14.3%, a difference of 0.090%), Immigrants from Iraq (14.3%, a difference of 0.14%), Soviet Union (14.3%, a difference of 0.18%), Immigrants from Hong Kong (14.2%, a difference of 0.21%), and Taiwanese (14.3%, a difference of 0.33%).
DemographicsRating | RankSingle Father Poverty
Immigrants | Vietnam
100.0
/100
|
#14
Exceptional
14.1%
Sri Lankans
100.0
/100
|
#15
Exceptional
14.2%
Immigrants | Iran
100.0
/100
|
#16
Exceptional
14.2%
Immigrants | Hong Kong
100.0
/100
|
#17
Exceptional
14.2%
Soviet Union
100.0
/100
|
#18
Exceptional
14.3%
Immigrants | Iraq
100.0
/100
|
#19
Exceptional
14.3%
Immigrants | Singapore
100.0
/100
|
#20
Exceptional
14.3%
Immigrants | Afghanistan
100.0
/100
|
#21
Exceptional
14.3%
Taiwanese
100.0
/100
|
#22
Exceptional
14.3%
Immigrants | Egypt
100.0
/100
|
#23
Exceptional
14.4%
Immigrants | South Eastern Asia
100.0
/100
|
#24
Exceptional
14.4%
Iranians
100.0
/100
|
#25
Exceptional
14.4%
Spanish American Indians
100.0
/100
|
#26
Exceptional
14.4%
Nepalese
100.0
/100
|
#27
Exceptional
14.4%
Immigrants | South Central Asia
100.0
/100
|
#28
Exceptional
14.5%