Chinese vs Immigrants from Kuwait Single Male Poverty

COMPARE

Chinese
Race
Ancestry
AfghanAfricanAlaska NativeAlaskan AthabascanAlbanianAleutAlsatianAmericanApacheArabArapahoArgentineanArmenianAssyrian/Chaldean/SyriacAustralianAustrianBahamianBangladeshiBarbadianBasqueBelgianBelizeanBermudanBhutaneseBlackfeetBolivianBrazilianBritishBritish West IndianBulgarianBurmeseCajunCambodianCanadianCape VerdeanCarpatho RusynCelticCentral AmericanCentral American IndianCherokeeCheyenneChickasawChileanChineseChippewaChoctawColombianColvilleComancheCosta RicanCreeCreekCroatianCrowCubanCypriotCzechCzechoslovakianDanishDelawareDominicanDutchDutch West IndianEastern EuropeanEcuadorianEgyptianEnglishEstonianEthiopianEuropeanFijianFilipinoFinnishFrenchFrench American IndianFrench CanadianGermanGerman RussianGhanaianGreekGuamanian/ChamorroGuatemalanGuyaneseHaitianHmongHonduranHopiHoumaHungarianIcelanderIndian (Asian)IndonesianInupiatIranianIraqiIrishIroquoisIsraeliItalianJamaicanJapaneseJordanianKenyanKiowaKoreanLaotianLatvianLebaneseLiberianLithuanianLumbeeLuxembourgerMacedonianMalaysianMalteseMarshalleseMenomineeMexicanMexican American IndianMongolianMoroccanNative HawaiianNavajoNepaleseNew ZealanderNicaraguanNigerianNorthern EuropeanNorwegianOkinawanOsageOttawaPaiutePakistaniPalestinianPanamanianParaguayanPennsylvania GermanPeruvianPimaPolishPortuguesePotawatomiPuebloPuerto RicanPuget Sound SalishRomanianRussianSalvadoranSamoanScandinavianScotch-IrishScottishSeminoleSenegaleseSerbianShoshoneSierra LeoneanSiouxSlavicSlovakSloveneSomaliSouth AfricanSouth AmericanSouth American IndianSoviet UnionSpaniardSpanishSpanish AmericanSpanish American IndianSri LankanSubsaharan AfricanSudaneseSwedishSwissSyrianTaiwaneseThaiTlingit-HaidaTohono O'OdhamTonganTrinidadian and TobagonianTsimshianTurkishU.S. Virgin IslanderUgandanUkrainianUruguayanUteVenezuelanVietnameseWelshWest IndianYakamaYaquiYugoslavianYumanYup'ikZimbabwean
Immigration
NonimmigrantsImmigrantsAfghanistanAfricaAlbaniaArgentinaArmeniaAsiaAustraliaAustriaBahamasBangladeshBarbadosBelarusBelgiumBelizeBoliviaBosnia and HerzegovinaBrazilBulgariaBurma/MyanmarCabo VerdeCambodiaCameroonCanadaCaribbeanCentral AmericaChileChinaColombiaCongoCosta RicaCroatiaCubaCzechoslovakiaDenmarkDominicaDominican RepublicEastern AfricaEastern AsiaEastern EuropeEcuadorEgyptEl SalvadorEnglandEritreaEthiopiaEuropeFijiFranceGermanyGhanaGreeceGrenadaGuatemalaGuyanaHaitiHondurasHong KongHungaryIndiaIndonesiaIranIraqIrelandIsraelItalyJamaicaJapanJordanKazakhstanKenyaKoreaLaosLatin AmericaLatviaLebanonLiberiaLithuaniaMalaysiaMexicoMicronesiaMiddle AfricaMoldovaMoroccoNepalNetherlandsNicaraguaNigeriaNorth AmericaNorth MacedoniaNorthern AfricaNorthern EuropeNorwayOceaniaPakistanPanamaPeruPhilippinesPolandPortugalRomaniaRussiaSaudi ArabiaScotlandSenegalSerbiaSierra LeoneSingaporeSomaliaSouth AfricaSouth AmericaSouth Central AsiaSouth Eastern AsiaSouthern EuropeSpainSri LankaSt. Vincent and the GrenadinesSudanSwedenSwitzerlandSyriaTaiwanThailandTrinidad and TobagoTurkeyUgandaUkraineUruguayUzbekistanVenezuelaVietnamWest IndiesWestern AfricaWestern AsiaWestern EuropeYemenZaireZimbabweAzores
Immigrants from Kuwait
Race
Ancestry
AfghanAfricanAlaska NativeAlaskan AthabascanAlbanianAleutAlsatianAmericanApacheArabArapahoArgentineanArmenianAssyrian/Chaldean/SyriacAustralianAustrianBahamianBangladeshiBarbadianBasqueBelgianBelizeanBermudanBhutaneseBlackfeetBolivianBrazilianBritishBritish West IndianBulgarianBurmeseCajunCambodianCanadianCape VerdeanCarpatho RusynCelticCentral AmericanCentral American IndianCherokeeCheyenneChickasawChileanChippewaChoctawColombianColvilleComancheCosta RicanCreeCreekCroatianCrowCubanCypriotCzechCzechoslovakianDanishDelawareDominicanDutchDutch West IndianEastern EuropeanEcuadorianEgyptianEnglishEstonianEthiopianEuropeanFijianFilipinoFinnishFrenchFrench American IndianFrench CanadianGermanGerman RussianGhanaianGreekGuamanian/ChamorroGuatemalanGuyaneseHaitianHmongHonduranHopiHoumaHungarianIcelanderIndian (Asian)IndonesianInupiatIranianIraqiIrishIroquoisIsraeliItalianJamaicanJapaneseJordanianKenyanKiowaKoreanLaotianLatvianLebaneseLiberianLithuanianLumbeeLuxembourgerMacedonianMalaysianMalteseMarshalleseMenomineeMexicanMexican American IndianMongolianMoroccanNative HawaiianNavajoNepaleseNew ZealanderNicaraguanNigerianNorthern EuropeanNorwegianOkinawanOsageOttawaPaiutePakistaniPalestinianPanamanianParaguayanPennsylvania GermanPeruvianPimaPolishPortuguesePotawatomiPuebloPuerto RicanPuget Sound SalishRomanianRussianSalvadoranSamoanScandinavianScotch-IrishScottishSeminoleSenegaleseSerbianShoshoneSierra LeoneanSiouxSlavicSlovakSloveneSomaliSouth AfricanSouth AmericanSouth American IndianSoviet UnionSpaniardSpanishSpanish AmericanSpanish American IndianSri LankanSubsaharan AfricanSudaneseSwedishSwissSyrianTaiwaneseThaiTlingit-HaidaTohono O'OdhamTonganTrinidadian and TobagonianTsimshianTurkishU.S. Virgin IslanderUgandanUkrainianUruguayanUteVenezuelanVietnameseWelshWest IndianYakamaYaquiYugoslavianYumanYup'ikZimbabwean
Immigration
NonimmigrantsImmigrantsAfghanistanAfricaAlbaniaArgentinaArmeniaAsiaAustraliaAustriaBahamasBangladeshBarbadosBelarusBelgiumBelizeBoliviaBosnia and HerzegovinaBrazilBulgariaBurma/MyanmarCabo VerdeCambodiaCameroonCanadaCaribbeanCentral AmericaChileChinaColombiaCongoCosta RicaCroatiaCubaCzechoslovakiaDenmarkDominicaDominican RepublicEastern AfricaEastern AsiaEastern EuropeEcuadorEgyptEl SalvadorEnglandEritreaEthiopiaEuropeFijiFranceGermanyGhanaGreeceGrenadaGuatemalaGuyanaHaitiHondurasHong KongHungaryIndiaIndonesiaIranIraqIrelandIsraelItalyJamaicaJapanJordanKazakhstanKenyaKoreaKuwaitLaosLatin AmericaLatviaLebanonLiberiaLithuaniaMalaysiaMexicoMicronesiaMiddle AfricaMoldovaMoroccoNepalNetherlandsNicaraguaNigeriaNorth AmericaNorth MacedoniaNorthern AfricaNorthern EuropeNorwayOceaniaPakistanPanamaPeruPhilippinesPolandPortugalRomaniaRussiaSaudi ArabiaScotlandSenegalSerbiaSierra LeoneSingaporeSomaliaSouth AfricaSouth AmericaSouth Central AsiaSouth Eastern AsiaSouthern EuropeSpainSri LankaSt. Vincent and the GrenadinesSudanSwedenSwitzerlandSyriaTaiwanThailandTrinidad and TobagoTurkeyUgandaUkraineUruguayUzbekistanVenezuelaVietnamWest IndiesWestern AfricaWestern AsiaWestern EuropeYemenZaireZimbabweAzores
Single Male Poverty
Income
Poverty
Unemployment
Labor Participation
Family Structure
Vehicle Availability
Education Level
Disability

Single Male Poverty Comparison

Chinese

Immigrants from Kuwait

Exceptional
Fair
11.0%
SINGLE MALE POVERTY
100.0/ 100
METRIC RATING
14th/ 347
METRIC RANK
12.9%
SINGLE MALE POVERTY
31.9/ 100
METRIC RATING
187th/ 347
METRIC RANK

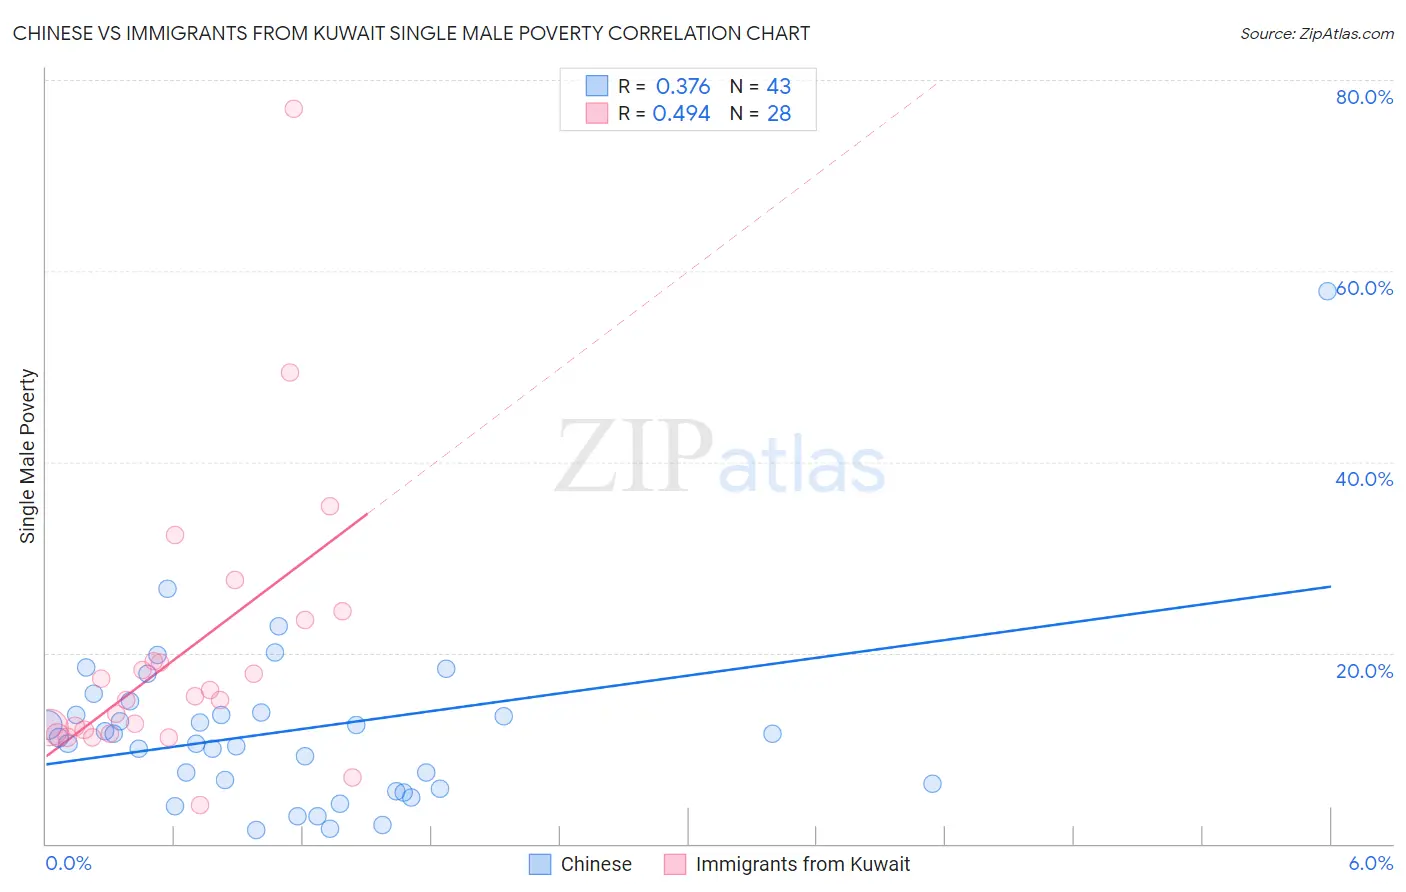
Chinese vs Immigrants from Kuwait Single Male Poverty Correlation Chart

The statistical analysis conducted on geographies consisting of 62,746,830 people shows a mild positive correlation between the proportion of Chinese and poverty level among single males in the United States with a correlation coefficient (R) of 0.376 and weighted average of 11.0%. Similarly, the statistical analysis conducted on geographies consisting of 129,103,469 people shows a moderate positive correlation between the proportion of Immigrants from Kuwait and poverty level among single males in the United States with a correlation coefficient (R) of 0.494 and weighted average of 12.9%, a difference of 17.7%.
Chinese vs Immigrants from Kuwait Single Male Poverty

Single Male Poverty Correlation Summary

MeasurementChineseImmigrants from Kuwait
Minimum1.5%4.1%
Maximum57.9%77.0%
Range56.4%73.0%
Mean11.9%19.7%
Median11.1%15.2%
Interquartile 25% (IQ1)5.7%11.7%
Interquartile 75% (IQ3)13.8%21.3%
Interquartile Range (IQR)8.1%9.6%
Standard Deviation (Sample)9.3%14.6%
Standard Deviation (Population)9.2%14.4%

Similar Demographics by Single Male Poverty

Demographics Similar to Chinese by Single Male Poverty

In terms of single male poverty, the demographic groups most similar to Chinese are Korean (11.0%, a difference of 0.050%), Immigrants from South Central Asia (10.9%, a difference of 0.57%), Immigrants from Afghanistan (10.9%, a difference of 0.69%), Immigrants from Philippines (10.9%, a difference of 0.76%), and Immigrants from Fiji (10.9%, a difference of 0.78%).
DemographicsRating | RankSingle Male Poverty
Afghans
100.0
/100
|
#7
Exceptional
10.7%
Thais
100.0
/100
|
#8
Exceptional
10.8%
Taiwanese
100.0
/100
|
#9
Exceptional
10.9%
Immigrants | Fiji
100.0
/100
|
#10
Exceptional
10.9%
Immigrants | Philippines
100.0
/100
|
#11
Exceptional
10.9%
Immigrants | Afghanistan
100.0
/100
|
#12
Exceptional
10.9%
Immigrants | South Central Asia
100.0
/100
|
#13
Exceptional
10.9%
Chinese
100.0
/100
|
#14
Exceptional
11.0%
Koreans
100.0
/100
|
#15
Exceptional
11.0%
Bhutanese
100.0
/100
|
#16
Exceptional
11.1%
Tsimshian
100.0
/100
|
#17
Exceptional
11.1%
Immigrants | Bolivia
100.0
/100
|
#18
Exceptional
11.1%
Immigrants | Moldova
100.0
/100
|
#19
Exceptional
11.2%
Ethiopians
100.0
/100
|
#20
Exceptional
11.2%
Asians
100.0
/100
|
#21
Exceptional
11.2%

Demographics Similar to Immigrants from Kuwait by Single Male Poverty

In terms of single male poverty, the demographic groups most similar to Immigrants from Kuwait are Nigerian (12.9%, a difference of 0.0%), Norwegian (12.9%, a difference of 0.010%), Macedonian (12.9%, a difference of 0.020%), Immigrants from Trinidad and Tobago (12.9%, a difference of 0.040%), and Immigrants from West Indies (12.9%, a difference of 0.060%).
DemographicsRating | RankSingle Male Poverty
Immigrants | North America
37.7
/100
|
#180
Fair
12.9%
Panamanians
37.6
/100
|
#181
Fair
12.9%
Moroccans
36.8
/100
|
#182
Fair
12.9%
Immigrants | West Indies
33.0
/100
|
#183
Fair
12.9%
Immigrants | Trinidad and Tobago
32.5
/100
|
#184
Fair
12.9%
Norwegians
32.0
/100
|
#185
Fair
12.9%
Nigerians
31.9
/100
|
#186
Fair
12.9%
Immigrants | Kuwait
31.9
/100
|
#187
Fair
12.9%
Macedonians
31.5
/100
|
#188
Fair
12.9%
Portuguese
30.2
/100
|
#189
Fair
12.9%
Arabs
27.0
/100
|
#190
Fair
13.0%
Immigrants | Thailand
26.6
/100
|
#191
Fair
13.0%
Immigrants | Jamaica
26.5
/100
|
#192
Fair
13.0%
Immigrants | South Africa
26.1
/100
|
#193
Fair
13.0%
Liberians
25.2
/100
|
#194
Fair
13.0%