Chilean vs Maltese Seniors Poverty Over the Age of 75

COMPARE

Chilean
Race
Ancestry
AfghanAfricanAlaska NativeAlaskan AthabascanAlbanianAleutAlsatianAmericanApacheArabArapahoArgentineanArmenianAssyrian/Chaldean/SyriacAustralianAustrianBahamianBangladeshiBarbadianBasqueBelgianBelizeanBermudanBhutaneseBlackfeetBolivianBrazilianBritishBritish West IndianBulgarianBurmeseCajunCambodianCanadianCape VerdeanCarpatho RusynCelticCentral AmericanCentral American IndianCherokeeCheyenneChickasawChileanChineseChippewaChoctawColombianColvilleComancheCosta RicanCreeCreekCroatianCrowCubanCypriotCzechCzechoslovakianDanishDelawareDominicanDutchDutch West IndianEastern EuropeanEcuadorianEgyptianEnglishEstonianEthiopianEuropeanFijianFilipinoFinnishFrenchFrench American IndianFrench CanadianGermanGerman RussianGhanaianGreekGuamanian/ChamorroGuatemalanGuyaneseHaitianHmongHonduranHopiHoumaHungarianIcelanderIndian (Asian)IndonesianInupiatIranianIraqiIrishIroquoisIsraeliItalianJamaicanJapaneseJordanianKenyanKiowaKoreanLaotianLatvianLebaneseLiberianLithuanianLumbeeLuxembourgerMacedonianMalaysianMarshalleseMenomineeMexicanMexican American IndianMongolianMoroccanNative HawaiianNavajoNepaleseNew ZealanderNicaraguanNigerianNorthern EuropeanNorwegianOkinawanOsageOttawaPaiutePakistaniPalestinianPanamanianParaguayanPennsylvania GermanPeruvianPimaPolishPortuguesePotawatomiPuebloPuerto RicanPuget Sound SalishRomanianRussianSalvadoranSamoanScandinavianScotch-IrishScottishSeminoleSenegaleseSerbianShoshoneSierra LeoneanSiouxSlavicSlovakSloveneSomaliSouth AfricanSouth AmericanSouth American IndianSoviet UnionSpaniardSpanishSpanish AmericanSpanish American IndianSri LankanSubsaharan AfricanSudaneseSwedishSwissSyrianTaiwaneseThaiTlingit-HaidaTohono O'OdhamTonganTrinidadian and TobagonianTsimshianTurkishU.S. Virgin IslanderUgandanUkrainianUruguayanUteVenezuelanVietnameseWelshWest IndianYakamaYaquiYugoslavianYumanYup'ikZimbabwean
Immigration
NonimmigrantsImmigrantsAfghanistanAfricaAlbaniaArgentinaArmeniaAsiaAustraliaAustriaBahamasBangladeshBarbadosBelarusBelgiumBelizeBoliviaBosnia and HerzegovinaBrazilBulgariaBurma/MyanmarCabo VerdeCambodiaCameroonCanadaCaribbeanCentral AmericaChileChinaColombiaCongoCosta RicaCroatiaCubaCzechoslovakiaDenmarkDominicaDominican RepublicEastern AfricaEastern AsiaEastern EuropeEcuadorEgyptEl SalvadorEnglandEritreaEthiopiaEuropeFijiFranceGermanyGhanaGreeceGrenadaGuatemalaGuyanaHaitiHondurasHong KongHungaryIndiaIndonesiaIranIraqIrelandIsraelItalyJamaicaJapanJordanKazakhstanKenyaKoreaKuwaitLaosLatin AmericaLatviaLebanonLiberiaLithuaniaMalaysiaMexicoMicronesiaMiddle AfricaMoldovaMoroccoNepalNetherlandsNicaraguaNigeriaNorth AmericaNorth MacedoniaNorthern AfricaNorthern EuropeNorwayOceaniaPakistanPanamaPeruPhilippinesPolandPortugalRomaniaRussiaSaudi ArabiaScotlandSenegalSerbiaSierra LeoneSingaporeSomaliaSouth AfricaSouth AmericaSouth Central AsiaSouth Eastern AsiaSouthern EuropeSpainSri LankaSt. Vincent and the GrenadinesSudanSwedenSwitzerlandSyriaTaiwanThailandTrinidad and TobagoTurkeyUgandaUkraineUruguayUzbekistanVenezuelaVietnamWest IndiesWestern AfricaWestern AsiaWestern EuropeYemenZaireZimbabweAzores
Maltese
Race
Ancestry
AfghanAfricanAlaska NativeAlaskan AthabascanAlbanianAleutAlsatianAmericanApacheArabArapahoArgentineanArmenianAssyrian/Chaldean/SyriacAustralianAustrianBahamianBangladeshiBarbadianBasqueBelgianBelizeanBermudanBhutaneseBlackfeetBolivianBrazilianBritishBritish West IndianBulgarianBurmeseCajunCambodianCanadianCape VerdeanCarpatho RusynCelticCentral AmericanCentral American IndianCherokeeCheyenneChickasawChineseChippewaChoctawColombianColvilleComancheCosta RicanCreeCreekCroatianCrowCubanCypriotCzechCzechoslovakianDanishDelawareDominicanDutchDutch West IndianEastern EuropeanEcuadorianEgyptianEnglishEstonianEthiopianEuropeanFijianFilipinoFinnishFrenchFrench American IndianFrench CanadianGermanGerman RussianGhanaianGreekGuamanian/ChamorroGuatemalanGuyaneseHaitianHmongHonduranHopiHoumaHungarianIcelanderIndian (Asian)IndonesianInupiatIranianIraqiIrishIroquoisIsraeliItalianJamaicanJapaneseJordanianKenyanKiowaKoreanLaotianLatvianLebaneseLiberianLithuanianLumbeeLuxembourgerMacedonianMalaysianMalteseMarshalleseMenomineeMexicanMexican American IndianMongolianMoroccanNative HawaiianNavajoNepaleseNew ZealanderNicaraguanNigerianNorthern EuropeanNorwegianOkinawanOsageOttawaPaiutePakistaniPalestinianPanamanianParaguayanPennsylvania GermanPeruvianPimaPolishPortuguesePotawatomiPuebloPuerto RicanPuget Sound SalishRomanianRussianSalvadoranSamoanScandinavianScotch-IrishScottishSeminoleSenegaleseSerbianShoshoneSierra LeoneanSiouxSlavicSlovakSloveneSomaliSouth AfricanSouth AmericanSouth American IndianSoviet UnionSpaniardSpanishSpanish AmericanSpanish American IndianSri LankanSubsaharan AfricanSudaneseSwedishSwissSyrianTaiwaneseThaiTlingit-HaidaTohono O'OdhamTonganTrinidadian and TobagonianTsimshianTurkishU.S. Virgin IslanderUgandanUkrainianUruguayanUteVenezuelanVietnameseWelshWest IndianYakamaYaquiYugoslavianYumanYup'ikZimbabwean
Immigration
NonimmigrantsImmigrantsAfghanistanAfricaAlbaniaArgentinaArmeniaAsiaAustraliaAustriaBahamasBangladeshBarbadosBelarusBelgiumBelizeBoliviaBosnia and HerzegovinaBrazilBulgariaBurma/MyanmarCabo VerdeCambodiaCameroonCanadaCaribbeanCentral AmericaChileChinaColombiaCongoCosta RicaCroatiaCubaCzechoslovakiaDenmarkDominicaDominican RepublicEastern AfricaEastern AsiaEastern EuropeEcuadorEgyptEl SalvadorEnglandEritreaEthiopiaEuropeFijiFranceGermanyGhanaGreeceGrenadaGuatemalaGuyanaHaitiHondurasHong KongHungaryIndiaIndonesiaIranIraqIrelandIsraelItalyJamaicaJapanJordanKazakhstanKenyaKoreaKuwaitLaosLatin AmericaLatviaLebanonLiberiaLithuaniaMalaysiaMexicoMicronesiaMiddle AfricaMoldovaMoroccoNepalNetherlandsNicaraguaNigeriaNorth AmericaNorth MacedoniaNorthern AfricaNorthern EuropeNorwayOceaniaPakistanPanamaPeruPhilippinesPolandPortugalRomaniaRussiaSaudi ArabiaScotlandSenegalSerbiaSierra LeoneSingaporeSomaliaSouth AfricaSouth AmericaSouth Central AsiaSouth Eastern AsiaSouthern EuropeSpainSri LankaSt. Vincent and the GrenadinesSudanSwedenSwitzerlandSyriaTaiwanThailandTrinidad and TobagoTurkeyUgandaUkraineUruguayUzbekistanVenezuelaVietnamWest IndiesWestern AfricaWestern AsiaWestern EuropeYemenZaireZimbabweAzores
Seniors Poverty Over the Age of 75
Income
Poverty
Unemployment
Labor Participation
Family Structure
Vehicle Availability
Education Level
Disability

Seniors Poverty Over the Age of 75 Comparison

Chileans

Maltese

Poor
Exceptional
12.6%
SENIORS POVERTY OVER THE AGE OF 75
13.7/ 100
METRIC RATING
198th/ 347
METRIC RANK
10.3%
SENIORS POVERTY OVER THE AGE OF 75
100.0/ 100
METRIC RATING
7th/ 347
METRIC RANK

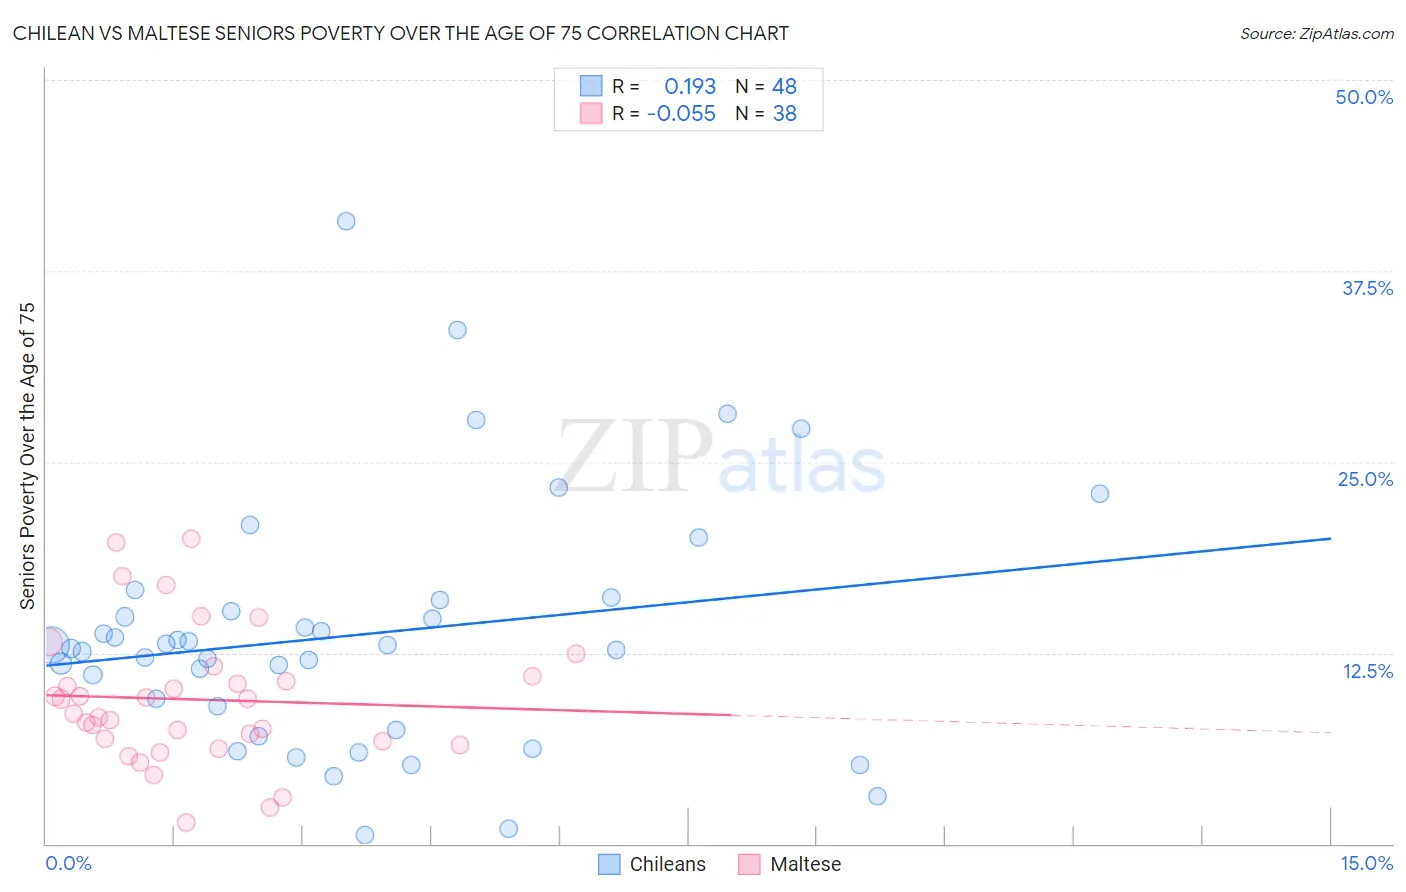
Chilean vs Maltese Seniors Poverty Over the Age of 75 Correlation Chart

The statistical analysis conducted on geographies consisting of 254,835,518 people shows a poor positive correlation between the proportion of Chileans and poverty level among seniors over the age of 75 in the United States with a correlation coefficient (R) of 0.193 and weighted average of 12.6%. Similarly, the statistical analysis conducted on geographies consisting of 126,057,505 people shows a slight negative correlation between the proportion of Maltese and poverty level among seniors over the age of 75 in the United States with a correlation coefficient (R) of -0.055 and weighted average of 10.3%, a difference of 22.9%.
Chilean vs Maltese Seniors Poverty Over the Age of 75

Seniors Poverty Over the Age of 75 Correlation Summary

MeasurementChileanMaltese
Minimum0.54%1.4%
Maximum40.7%19.9%
Range40.2%18.5%
Mean13.7%9.4%
Median12.9%9.0%
Interquartile 25% (IQ1)8.2%6.7%
Interquartile 75% (IQ3)15.6%10.9%
Interquartile Range (IQR)7.4%4.2%
Standard Deviation (Sample)8.1%4.4%
Standard Deviation (Population)8.0%4.3%

Similar Demographics by Seniors Poverty Over the Age of 75

Demographics Similar to Chileans by Seniors Poverty Over the Age of 75

In terms of seniors poverty over the age of 75, the demographic groups most similar to Chileans are Nepalese (12.6%, a difference of 0.11%), Immigrants from Lebanon (12.7%, a difference of 0.17%), Immigrants from Vietnam (12.7%, a difference of 0.27%), Immigrants from Eastern Europe (12.6%, a difference of 0.37%), and Paraguayan (12.7%, a difference of 0.47%).
DemographicsRating | RankSeniors Poverty Over the Age of 75
Liberians
23.2
/100
|
#191
Fair
12.5%
Choctaw
20.2
/100
|
#192
Fair
12.5%
Taiwanese
17.8
/100
|
#193
Poor
12.6%
Alsatians
17.7
/100
|
#194
Poor
12.6%
Immigrants | France
17.4
/100
|
#195
Poor
12.6%
Immigrants | Eastern Europe
16.0
/100
|
#196
Poor
12.6%
Nepalese
14.4
/100
|
#197
Poor
12.6%
Chileans
13.7
/100
|
#198
Poor
12.6%
Immigrants | Lebanon
12.7
/100
|
#199
Poor
12.7%
Immigrants | Vietnam
12.1
/100
|
#200
Poor
12.7%
Paraguayans
11.1
/100
|
#201
Poor
12.7%
Arapaho
10.9
/100
|
#202
Poor
12.7%
Immigrants | Southern Europe
10.7
/100
|
#203
Poor
12.7%
Immigrants | Eritrea
10.5
/100
|
#204
Poor
12.7%
Indians (Asian)
9.7
/100
|
#205
Tragic
12.7%

Demographics Similar to Maltese by Seniors Poverty Over the Age of 75

In terms of seniors poverty over the age of 75, the demographic groups most similar to Maltese are German (10.4%, a difference of 0.58%), Danish (10.2%, a difference of 0.65%), Norwegian (10.2%, a difference of 0.92%), English (10.4%, a difference of 0.92%), and Swedish (10.2%, a difference of 1.3%).
DemographicsRating | RankSeniors Poverty Over the Age of 75
Chinese
100.0
/100
|
#1
Exceptional
9.1%
Tlingit-Haida
100.0
/100
|
#2
Exceptional
9.7%
Native Hawaiians
100.0
/100
|
#3
Exceptional
10.1%
Swedes
100.0
/100
|
#4
Exceptional
10.2%
Norwegians
100.0
/100
|
#5
Exceptional
10.2%
Danes
100.0
/100
|
#6
Exceptional
10.2%
Maltese
100.0
/100
|
#7
Exceptional
10.3%
Germans
99.9
/100
|
#8
Exceptional
10.4%
English
99.9
/100
|
#9
Exceptional
10.4%
Scandinavians
99.9
/100
|
#10
Exceptional
10.4%
Immigrants | India
99.9
/100
|
#11
Exceptional
10.4%
Tongans
99.9
/100
|
#12
Exceptional
10.5%
Croatians
99.9
/100
|
#13
Exceptional
10.5%
Scottish
99.9
/100
|
#14
Exceptional
10.5%
Europeans
99.9
/100
|
#15
Exceptional
10.5%