Celtic vs Bhutanese Single Mother Poverty
COMPARE
Celtic
Bhutanese
Single Mother Poverty
Single Mother Poverty Comparison
Celtics
Bhutanese
30.9%
SINGLE MOTHER POVERTY
0.6/ 100
METRIC RATING
253rd/ 347
METRIC RANK
25.6%
SINGLE MOTHER POVERTY
100.0/ 100
METRIC RATING
12th/ 347
METRIC RANK
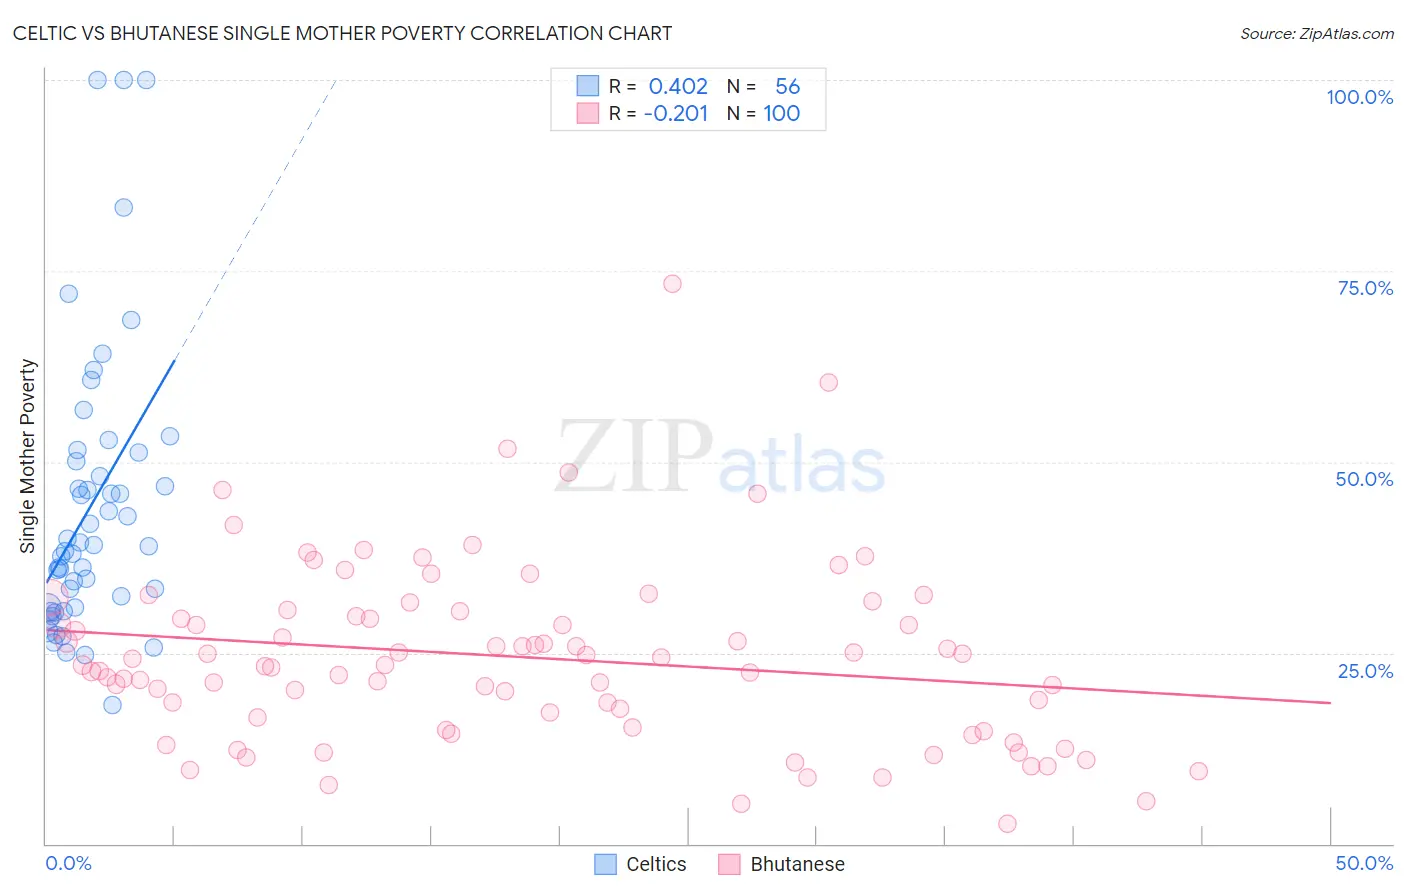
Celtic vs Bhutanese Single Mother Poverty Correlation Chart
The statistical analysis conducted on geographies consisting of 166,872,961 people shows a moderate positive correlation between the proportion of Celtics and poverty level among single mothers in the United States with a correlation coefficient (R) of 0.402 and weighted average of 30.9%. Similarly, the statistical analysis conducted on geographies consisting of 442,258,638 people shows a weak negative correlation between the proportion of Bhutanese and poverty level among single mothers in the United States with a correlation coefficient (R) of -0.201 and weighted average of 25.6%, a difference of 20.7%.
Single Mother Poverty Correlation Summary
| Measurement | Celtic | Bhutanese |
| Minimum | 18.2% | 2.6% |
| Maximum | 100.0% | 73.4% |
| Range | 81.8% | 70.8% |
| Mean | 44.3% | 24.4% |
| Median | 39.0% | 23.4% |
| Interquartile 25% (IQ1) | 30.9% | 15.9% |
| Interquartile 75% (IQ3) | 50.7% | 30.2% |
| Interquartile Range (IQR) | 19.7% | 14.3% |
| Standard Deviation (Sample) | 18.6% | 11.8% |
| Standard Deviation (Population) | 18.4% | 11.8% |
Similar Demographics by Single Mother Poverty
Demographics Similar to Celtics by Single Mother Poverty
In terms of single mother poverty, the demographic groups most similar to Celtics are Alaska Native (30.9%, a difference of 0.030%), Tlingit-Haida (30.9%, a difference of 0.040%), Senegalese (31.0%, a difference of 0.14%), Vietnamese (30.9%, a difference of 0.16%), and Belizean (31.0%, a difference of 0.25%).
| Demographics | Rating | Rank | Single Mother Poverty |
| Ecuadorians | 0.9 /100 | #246 | Tragic 30.8% |
| West Indians | 0.9 /100 | #247 | Tragic 30.8% |
| French Canadians | 0.9 /100 | #248 | Tragic 30.8% |
| Cape Verdeans | 0.8 /100 | #249 | Tragic 30.8% |
| Vietnamese | 0.7 /100 | #250 | Tragic 30.9% |
| Tlingit-Haida | 0.6 /100 | #251 | Tragic 30.9% |
| Alaska Natives | 0.6 /100 | #252 | Tragic 30.9% |
| Celtics | 0.6 /100 | #253 | Tragic 30.9% |
| Senegalese | 0.5 /100 | #254 | Tragic 31.0% |
| Belizeans | 0.5 /100 | #255 | Tragic 31.0% |
| Immigrants | West Indies | 0.4 /100 | #256 | Tragic 31.1% |
| Immigrants | Bahamas | 0.4 /100 | #257 | Tragic 31.1% |
| Immigrants | Caribbean | 0.4 /100 | #258 | Tragic 31.1% |
| Immigrants | Bangladesh | 0.4 /100 | #259 | Tragic 31.1% |
| Whites/Caucasians | 0.3 /100 | #260 | Tragic 31.2% |
Demographics Similar to Bhutanese by Single Mother Poverty
In terms of single mother poverty, the demographic groups most similar to Bhutanese are Iranian (25.5%, a difference of 0.37%), Indian (Asian) (25.8%, a difference of 0.52%), Immigrants from Singapore (25.8%, a difference of 0.67%), Immigrants from Ireland (25.8%, a difference of 0.86%), and Bolivian (25.9%, a difference of 1.1%).
| Demographics | Rating | Rank | Single Mother Poverty |
| Immigrants | Hong Kong | 100.0 /100 | #5 | Exceptional 24.4% |
| Thais | 100.0 /100 | #6 | Exceptional 24.5% |
| Chinese | 100.0 /100 | #7 | Exceptional 24.6% |
| Immigrants | Iran | 100.0 /100 | #8 | Exceptional 25.1% |
| Immigrants | Lithuania | 100.0 /100 | #9 | Exceptional 25.2% |
| Immigrants | South Central Asia | 100.0 /100 | #10 | Exceptional 25.3% |
| Iranians | 100.0 /100 | #11 | Exceptional 25.5% |
| Bhutanese | 100.0 /100 | #12 | Exceptional 25.6% |
| Indians (Asian) | 100.0 /100 | #13 | Exceptional 25.8% |
| Immigrants | Singapore | 100.0 /100 | #14 | Exceptional 25.8% |
| Immigrants | Ireland | 100.0 /100 | #15 | Exceptional 25.8% |
| Bolivians | 100.0 /100 | #16 | Exceptional 25.9% |
| Asians | 100.0 /100 | #17 | Exceptional 26.0% |
| Immigrants | Pakistan | 100.0 /100 | #18 | Exceptional 26.0% |
| Immigrants | Eastern Asia | 100.0 /100 | #19 | Exceptional 26.1% |