Carpatho Rusyn vs South African Male Poverty
COMPARE
Carpatho Rusyn
South African
Male Poverty
Male Poverty Comparison
Carpatho Rusyns
South Africans
10.2%
MALE POVERTY
96.9/ 100
METRIC RATING
75th/ 347
METRIC RANK
10.7%
MALE POVERTY
86.8/ 100
METRIC RATING
123rd/ 347
METRIC RANK
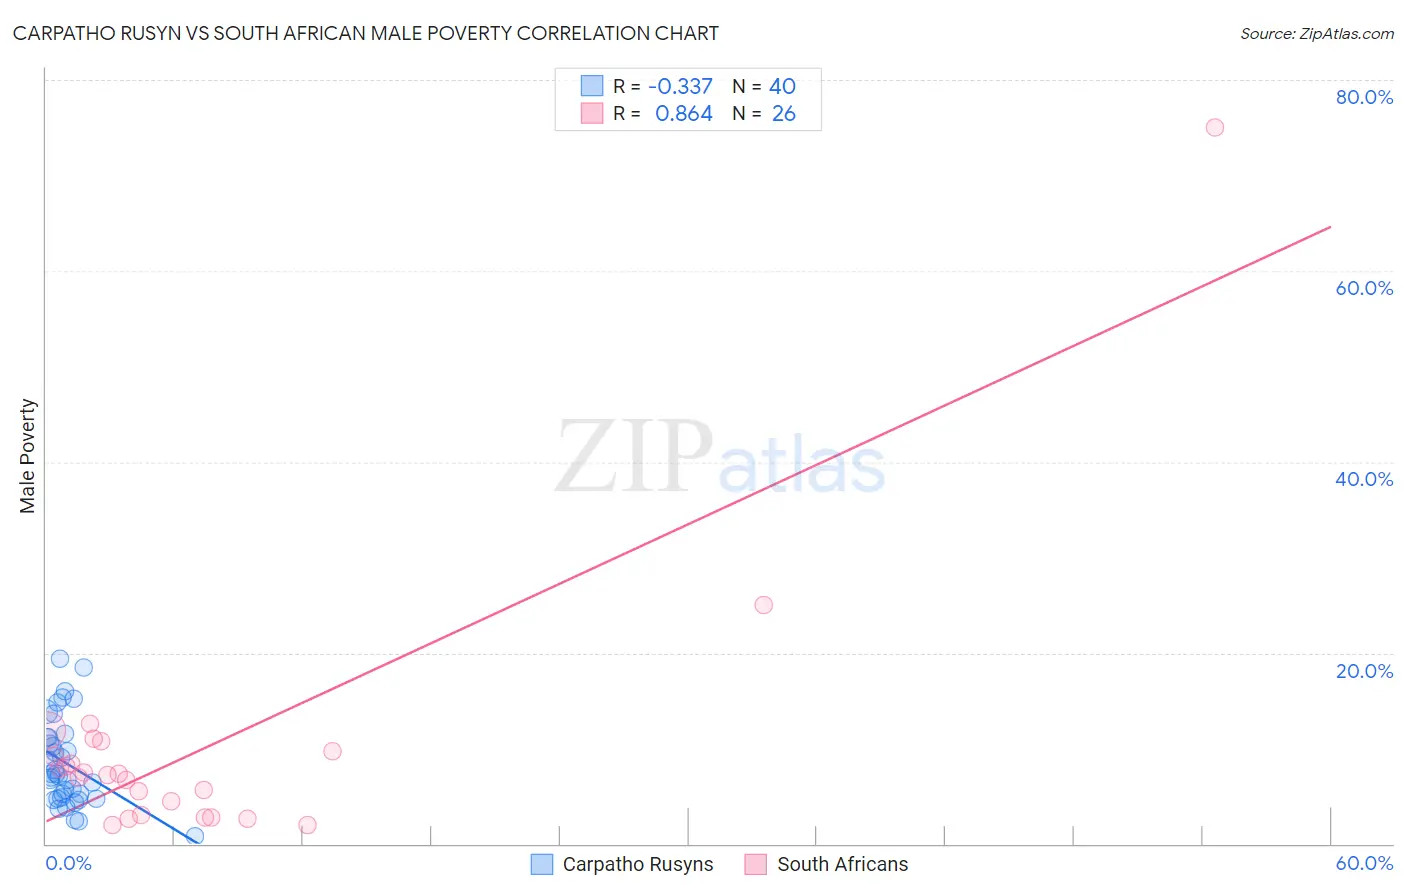
Carpatho Rusyn vs South African Male Poverty Correlation Chart
The statistical analysis conducted on geographies consisting of 58,868,147 people shows a mild negative correlation between the proportion of Carpatho Rusyns and poverty level among males in the United States with a correlation coefficient (R) of -0.337 and weighted average of 10.2%. Similarly, the statistical analysis conducted on geographies consisting of 182,517,352 people shows a very strong positive correlation between the proportion of South Africans and poverty level among males in the United States with a correlation coefficient (R) of 0.864 and weighted average of 10.7%, a difference of 4.2%.
Male Poverty Correlation Summary
| Measurement | Carpatho Rusyn | South African |
| Minimum | 0.81% | 2.0% |
| Maximum | 19.4% | 75.0% |
| Range | 18.6% | 73.0% |
| Mean | 8.4% | 9.9% |
| Median | 7.2% | 7.2% |
| Interquartile 25% (IQ1) | 4.8% | 3.0% |
| Interquartile 75% (IQ3) | 11.2% | 9.7% |
| Interquartile Range (IQR) | 6.3% | 6.6% |
| Standard Deviation (Sample) | 4.6% | 14.1% |
| Standard Deviation (Population) | 4.5% | 13.8% |
Similar Demographics by Male Poverty
Demographics Similar to Carpatho Rusyns by Male Poverty
In terms of male poverty, the demographic groups most similar to Carpatho Rusyns are Immigrants from Eastern Europe (10.2%, a difference of 0.0%), Dutch (10.2%, a difference of 0.010%), Immigrants from Belgium (10.3%, a difference of 0.040%), Irish (10.3%, a difference of 0.060%), and Immigrants from Asia (10.2%, a difference of 0.080%).
| Demographics | Rating | Rank | Male Poverty |
| Immigrants | Sri Lanka | 97.2 /100 | #68 | Exceptional 10.2% |
| Immigrants | Australia | 97.1 /100 | #69 | Exceptional 10.2% |
| Paraguayans | 97.1 /100 | #70 | Exceptional 10.2% |
| Europeans | 97.1 /100 | #71 | Exceptional 10.2% |
| Immigrants | Canada | 97.1 /100 | #72 | Exceptional 10.2% |
| Immigrants | Asia | 97.0 /100 | #73 | Exceptional 10.2% |
| Immigrants | Eastern Europe | 96.9 /100 | #74 | Exceptional 10.2% |
| Carpatho Rusyns | 96.9 /100 | #75 | Exceptional 10.2% |
| Dutch | 96.9 /100 | #76 | Exceptional 10.2% |
| Immigrants | Belgium | 96.8 /100 | #77 | Exceptional 10.3% |
| Irish | 96.8 /100 | #78 | Exceptional 10.3% |
| Immigrants | North America | 96.5 /100 | #79 | Exceptional 10.3% |
| English | 96.4 /100 | #80 | Exceptional 10.3% |
| Belgians | 95.9 /100 | #81 | Exceptional 10.3% |
| Egyptians | 95.9 /100 | #82 | Exceptional 10.3% |
Demographics Similar to South Africans by Male Poverty
In terms of male poverty, the demographic groups most similar to South Africans are French (10.7%, a difference of 0.030%), Native Hawaiian (10.7%, a difference of 0.040%), Peruvian (10.7%, a difference of 0.060%), Immigrants from China (10.7%, a difference of 0.070%), and Immigrants from Hungary (10.7%, a difference of 0.17%).
| Demographics | Rating | Rank | Male Poverty |
| Sri Lankans | 88.1 /100 | #116 | Excellent 10.6% |
| Immigrants | South Eastern Asia | 88.1 /100 | #117 | Excellent 10.6% |
| Okinawans | 87.6 /100 | #118 | Excellent 10.7% |
| Immigrants | Hungary | 87.6 /100 | #119 | Excellent 10.7% |
| Immigrants | China | 87.1 /100 | #120 | Excellent 10.7% |
| Peruvians | 87.1 /100 | #121 | Excellent 10.7% |
| Native Hawaiians | 87.0 /100 | #122 | Excellent 10.7% |
| South Africans | 86.8 /100 | #123 | Excellent 10.7% |
| French | 86.7 /100 | #124 | Excellent 10.7% |
| Immigrants | Norway | 86.0 /100 | #125 | Excellent 10.7% |
| Immigrants | Ukraine | 84.3 /100 | #126 | Excellent 10.7% |
| Puget Sound Salish | 84.3 /100 | #127 | Excellent 10.7% |
| Immigrants | Western Europe | 84.2 /100 | #128 | Excellent 10.7% |
| Immigrants | Peru | 84.1 /100 | #129 | Excellent 10.7% |
| Chileans | 83.9 /100 | #130 | Excellent 10.7% |