Carpatho Rusyn vs Immigrants from Belize Female Poverty Among 25-34 Year Olds

COMPARE

Carpatho Rusyn
Race
Ancestry
AfghanAfricanAlaska NativeAlaskan AthabascanAlbanianAleutAlsatianAmericanApacheArabArapahoArgentineanArmenianAssyrian/Chaldean/SyriacAustralianAustrianBahamianBangladeshiBarbadianBasqueBelgianBelizeanBermudanBhutaneseBlackfeetBolivianBrazilianBritishBritish West IndianBulgarianBurmeseCajunCambodianCanadianCape VerdeanCarpatho RusynCelticCentral AmericanCentral American IndianCherokeeCheyenneChickasawChileanChineseChippewaChoctawColombianColvilleComancheCosta RicanCreeCreekCroatianCrowCubanCypriotCzechCzechoslovakianDanishDelawareDominicanDutchDutch West IndianEastern EuropeanEcuadorianEgyptianEnglishEstonianEthiopianEuropeanFijianFilipinoFinnishFrenchFrench American IndianFrench CanadianGermanGerman RussianGhanaianGreekGuamanian/ChamorroGuatemalanGuyaneseHaitianHmongHonduranHopiHoumaHungarianIcelanderIndian (Asian)IndonesianInupiatIranianIraqiIrishIroquoisIsraeliItalianJamaicanJapaneseJordanianKenyanKiowaKoreanLaotianLatvianLebaneseLiberianLithuanianLumbeeLuxembourgerMacedonianMalaysianMalteseMarshalleseMenomineeMexicanMexican American IndianMongolianMoroccanNative HawaiianNavajoNepaleseNew ZealanderNicaraguanNigerianNorthern EuropeanNorwegianOkinawanOsageOttawaPaiutePakistaniPalestinianPanamanianParaguayanPennsylvania GermanPeruvianPimaPolishPortuguesePotawatomiPuebloPuerto RicanPuget Sound SalishRomanianRussianSalvadoranSamoanScandinavianScotch-IrishScottishSeminoleSenegaleseSerbianShoshoneSierra LeoneanSiouxSlavicSlovakSloveneSomaliSouth AfricanSouth AmericanSouth American IndianSoviet UnionSpaniardSpanishSpanish AmericanSpanish American IndianSri LankanSubsaharan AfricanSudaneseSwedishSwissSyrianTaiwaneseThaiTlingit-HaidaTohono O'OdhamTonganTrinidadian and TobagonianTsimshianTurkishU.S. Virgin IslanderUgandanUkrainianUruguayanUteVenezuelanVietnameseWelshWest IndianYakamaYaquiYugoslavianYumanYup'ikZimbabwean
Immigration
NonimmigrantsImmigrantsAfghanistanAfricaAlbaniaArgentinaArmeniaAsiaAustraliaAustriaBahamasBangladeshBarbadosBelarusBelgiumBoliviaBosnia and HerzegovinaBrazilBulgariaBurma/MyanmarCabo VerdeCambodiaCameroonCanadaCaribbeanCentral AmericaChileChinaColombiaCongoCosta RicaCroatiaCubaCzechoslovakiaDenmarkDominicaDominican RepublicEastern AfricaEastern AsiaEastern EuropeEcuadorEgyptEl SalvadorEnglandEritreaEthiopiaEuropeFijiFranceGermanyGhanaGreeceGrenadaGuatemalaGuyanaHaitiHondurasHong KongHungaryIndiaIndonesiaIranIraqIrelandIsraelItalyJamaicaJapanJordanKazakhstanKenyaKoreaKuwaitLaosLatin AmericaLatviaLebanonLiberiaLithuaniaMalaysiaMexicoMicronesiaMiddle AfricaMoldovaMoroccoNepalNetherlandsNicaraguaNigeriaNorth AmericaNorth MacedoniaNorthern AfricaNorthern EuropeNorwayOceaniaPakistanPanamaPeruPhilippinesPolandPortugalRomaniaRussiaSaudi ArabiaScotlandSenegalSerbiaSierra LeoneSingaporeSomaliaSouth AfricaSouth AmericaSouth Central AsiaSouth Eastern AsiaSouthern EuropeSpainSri LankaSt. Vincent and the GrenadinesSudanSwedenSwitzerlandSyriaTaiwanThailandTrinidad and TobagoTurkeyUgandaUkraineUruguayUzbekistanVenezuelaVietnamWest IndiesWestern AfricaWestern AsiaWestern EuropeYemenZaireZimbabweAzores
Immigrants from Belize
Race
Ancestry
AfghanAfricanAlaska NativeAlaskan AthabascanAlbanianAleutAlsatianAmericanApacheArabArapahoArgentineanArmenianAssyrian/Chaldean/SyriacAustralianAustrianBahamianBangladeshiBarbadianBasqueBelgianBelizeanBermudanBhutaneseBlackfeetBolivianBrazilianBritishBritish West IndianBulgarianBurmeseCajunCambodianCanadianCape VerdeanCelticCentral AmericanCentral American IndianCherokeeCheyenneChickasawChileanChineseChippewaChoctawColombianColvilleComancheCosta RicanCreeCreekCroatianCrowCubanCypriotCzechCzechoslovakianDanishDelawareDominicanDutchDutch West IndianEastern EuropeanEcuadorianEgyptianEnglishEstonianEthiopianEuropeanFijianFilipinoFinnishFrenchFrench American IndianFrench CanadianGermanGerman RussianGhanaianGreekGuamanian/ChamorroGuatemalanGuyaneseHaitianHmongHonduranHopiHoumaHungarianIcelanderIndian (Asian)IndonesianInupiatIranianIraqiIrishIroquoisIsraeliItalianJamaicanJapaneseJordanianKenyanKiowaKoreanLaotianLatvianLebaneseLiberianLithuanianLumbeeLuxembourgerMacedonianMalaysianMalteseMarshalleseMenomineeMexicanMexican American IndianMongolianMoroccanNative HawaiianNavajoNepaleseNew ZealanderNicaraguanNigerianNorthern EuropeanNorwegianOkinawanOsageOttawaPaiutePakistaniPalestinianPanamanianParaguayanPennsylvania GermanPeruvianPimaPolishPortuguesePotawatomiPuebloPuerto RicanPuget Sound SalishRomanianRussianSalvadoranSamoanScandinavianScotch-IrishScottishSeminoleSenegaleseSerbianShoshoneSierra LeoneanSiouxSlavicSlovakSloveneSomaliSouth AfricanSouth AmericanSouth American IndianSoviet UnionSpaniardSpanishSpanish AmericanSpanish American IndianSri LankanSubsaharan AfricanSudaneseSwedishSwissSyrianTaiwaneseThaiTlingit-HaidaTohono O'OdhamTonganTrinidadian and TobagonianTsimshianTurkishU.S. Virgin IslanderUgandanUkrainianUruguayanUteVenezuelanVietnameseWelshWest IndianYakamaYaquiYugoslavianYumanYup'ikZimbabwean
Immigration
NonimmigrantsImmigrantsAfghanistanAfricaAlbaniaArgentinaArmeniaAsiaAustraliaAustriaBahamasBangladeshBarbadosBelarusBelgiumBelizeBoliviaBosnia and HerzegovinaBrazilBulgariaBurma/MyanmarCabo VerdeCambodiaCameroonCanadaCaribbeanCentral AmericaChileChinaColombiaCongoCosta RicaCroatiaCubaCzechoslovakiaDenmarkDominicaDominican RepublicEastern AfricaEastern AsiaEastern EuropeEcuadorEgyptEl SalvadorEnglandEritreaEthiopiaEuropeFijiFranceGermanyGhanaGreeceGrenadaGuatemalaGuyanaHaitiHondurasHong KongHungaryIndiaIndonesiaIranIraqIrelandIsraelItalyJamaicaJapanJordanKazakhstanKenyaKoreaKuwaitLaosLatin AmericaLatviaLebanonLiberiaLithuaniaMalaysiaMexicoMicronesiaMiddle AfricaMoldovaMoroccoNepalNetherlandsNicaraguaNigeriaNorth AmericaNorth MacedoniaNorthern AfricaNorthern EuropeNorwayOceaniaPakistanPanamaPeruPhilippinesPolandPortugalRomaniaRussiaSaudi ArabiaScotlandSenegalSerbiaSierra LeoneSingaporeSomaliaSouth AfricaSouth AmericaSouth Central AsiaSouth Eastern AsiaSouthern EuropeSpainSri LankaSt. Vincent and the GrenadinesSudanSwedenSwitzerlandSyriaTaiwanThailandTrinidad and TobagoTurkeyUgandaUkraineUruguayUzbekistanVenezuelaVietnamWest IndiesWestern AfricaWestern AsiaWestern EuropeYemenZaireZimbabweAzores
Female Poverty Among 25-34 Year Olds
Income
Poverty
Unemployment
Labor Participation
Family Structure
Vehicle Availability
Education Level
Disability

Female Poverty Among 25-34 Year Olds Comparison

Carpatho Rusyns

Immigrants from Belize

Exceptional
Tragic
12.8%
FEMALE POVERTY AMONG 25-34 YEAR OLDS
93.0/ 100
METRIC RATING
120th/ 347
METRIC RANK
15.3%
FEMALE POVERTY AMONG 25-34 YEAR OLDS
0.2/ 100
METRIC RATING
262nd/ 347
METRIC RANK

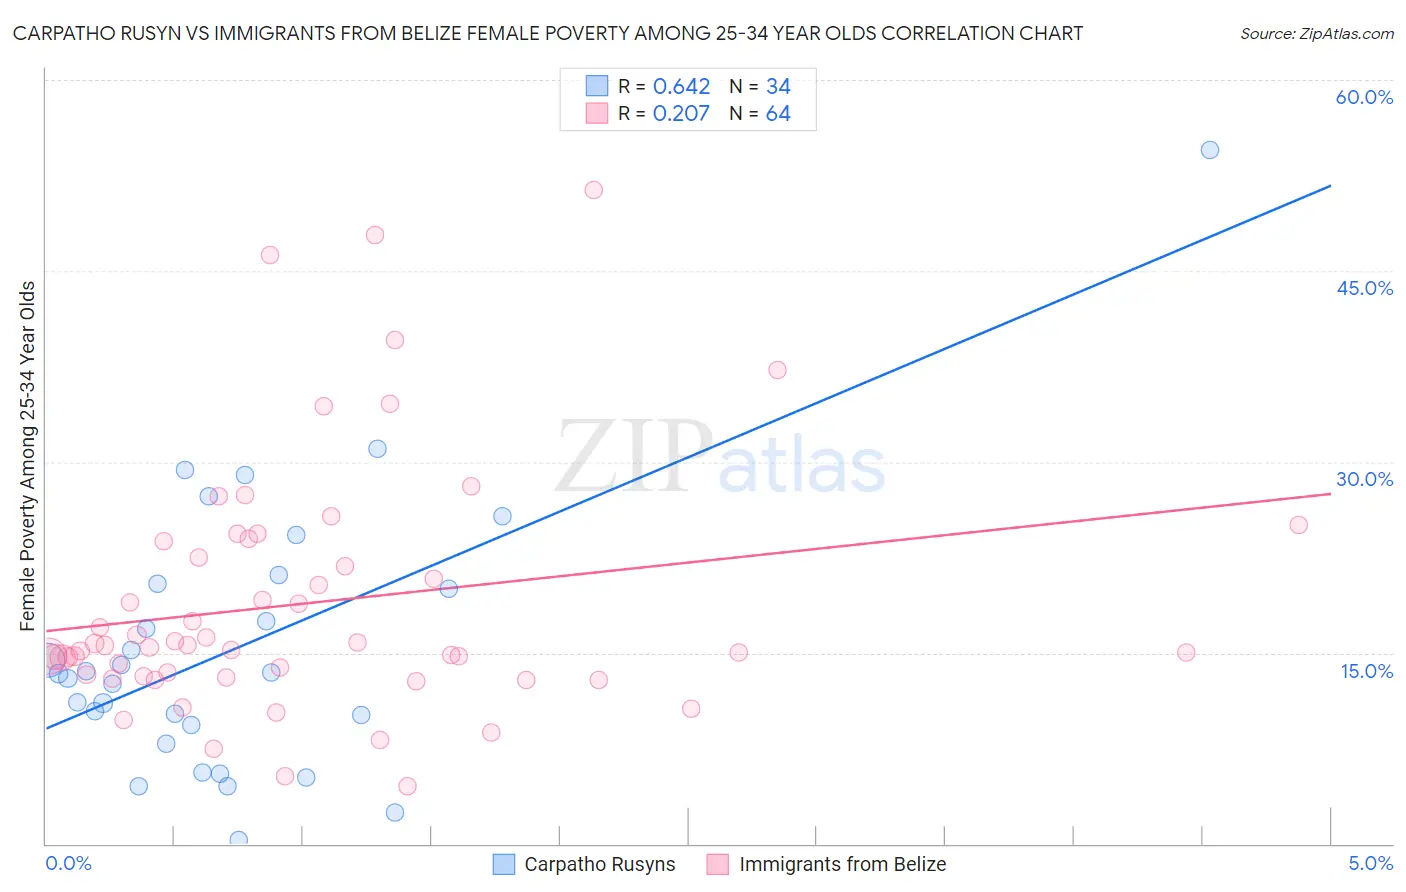
Carpatho Rusyn vs Immigrants from Belize Female Poverty Among 25-34 Year Olds Correlation Chart

The statistical analysis conducted on geographies consisting of 58,469,179 people shows a significant positive correlation between the proportion of Carpatho Rusyns and poverty level among females between the ages 25 and 34 in the United States with a correlation coefficient (R) of 0.642 and weighted average of 12.8%. Similarly, the statistical analysis conducted on geographies consisting of 129,916,036 people shows a weak positive correlation between the proportion of Immigrants from Belize and poverty level among females between the ages 25 and 34 in the United States with a correlation coefficient (R) of 0.207 and weighted average of 15.3%, a difference of 19.6%.
Carpatho Rusyn vs Immigrants from Belize Female Poverty Among 25-34 Year Olds

Female Poverty Among 25-34 Year Olds Correlation Summary

MeasurementCarpatho RusynImmigrants from Belize
Minimum0.28%4.5%
Maximum54.5%51.4%
Range54.3%46.9%
Mean15.4%18.9%
Median13.4%15.5%
Interquartile 25% (IQ1)9.3%13.2%
Interquartile 75% (IQ3)20.4%23.1%
Interquartile Range (IQR)11.1%9.9%
Standard Deviation (Sample)10.6%9.7%
Standard Deviation (Population)10.5%9.7%

Similar Demographics by Female Poverty Among 25-34 Year Olds

Demographics Similar to Carpatho Rusyns by Female Poverty Among 25-34 Year Olds

In terms of female poverty among 25-34 year olds, the demographic groups most similar to Carpatho Rusyns are Immigrants from Nepal (12.8%, a difference of 0.0%), Mongolian (12.8%, a difference of 0.010%), Immigrants from Kuwait (12.8%, a difference of 0.030%), Romanian (12.8%, a difference of 0.070%), and Immigrants from Western Asia (12.8%, a difference of 0.080%).
DemographicsRating | RankFemale Poverty Among 25-34 Year Olds
Immigrants | Syria
93.8
/100
|
#113
Exceptional
12.8%
Immigrants | Southern Europe
93.6
/100
|
#114
Exceptional
12.8%
Immigrants | Brazil
93.3
/100
|
#115
Exceptional
12.8%
Chileans
93.2
/100
|
#116
Exceptional
12.8%
Immigrants | Kuwait
93.1
/100
|
#117
Exceptional
12.8%
Mongolians
93.0
/100
|
#118
Exceptional
12.8%
Immigrants | Nepal
93.0
/100
|
#119
Exceptional
12.8%
Carpatho Rusyns
93.0
/100
|
#120
Exceptional
12.8%
Romanians
92.8
/100
|
#121
Exceptional
12.8%
Immigrants | Western Asia
92.7
/100
|
#122
Exceptional
12.8%
Slovenes
92.7
/100
|
#123
Exceptional
12.8%
Immigrants | Netherlands
92.0
/100
|
#124
Exceptional
12.8%
Immigrants | Canada
91.5
/100
|
#125
Exceptional
12.9%
Immigrants | Fiji
91.2
/100
|
#126
Exceptional
12.9%
Czechs
90.3
/100
|
#127
Exceptional
12.9%

Demographics Similar to Immigrants from Belize by Female Poverty Among 25-34 Year Olds

In terms of female poverty among 25-34 year olds, the demographic groups most similar to Immigrants from Belize are Liberian (15.3%, a difference of 0.040%), Mexican American Indian (15.4%, a difference of 0.24%), Marshallese (15.3%, a difference of 0.26%), Immigrants from Cuba (15.2%, a difference of 0.63%), and Nepalese (15.2%, a difference of 0.65%).
DemographicsRating | RankFemale Poverty Among 25-34 Year Olds
Immigrants | Laos
0.3
/100
|
#255
Tragic
15.2%
West Indians
0.3
/100
|
#256
Tragic
15.2%
Immigrants | Burma/Myanmar
0.3
/100
|
#257
Tragic
15.2%
Nepalese
0.2
/100
|
#258
Tragic
15.2%
Immigrants | Cuba
0.2
/100
|
#259
Tragic
15.2%
Marshallese
0.2
/100
|
#260
Tragic
15.3%
Liberians
0.2
/100
|
#261
Tragic
15.3%
Immigrants | Belize
0.2
/100
|
#262
Tragic
15.3%
Mexican American Indians
0.2
/100
|
#263
Tragic
15.4%
Pennsylvania Germans
0.1
/100
|
#264
Tragic
15.4%
Immigrants | Liberia
0.1
/100
|
#265
Tragic
15.4%
Immigrants | Somalia
0.1
/100
|
#266
Tragic
15.4%
Central Americans
0.1
/100
|
#267
Tragic
15.5%
Immigrants | Senegal
0.1
/100
|
#268
Tragic
15.6%
Sub-Saharan Africans
0.1
/100
|
#269
Tragic
15.6%