Cape Verdean vs Romanian Single Male Poverty
COMPARE
Cape Verdean
Romanian
Single Male Poverty
Single Male Poverty Comparison
Cape Verdeans
Romanians
13.8%
SINGLE MALE POVERTY
0.2/ 100
METRIC RATING
263rd/ 347
METRIC RANK
12.5%
SINGLE MALE POVERTY
86.4/ 100
METRIC RATING
126th/ 347
METRIC RANK
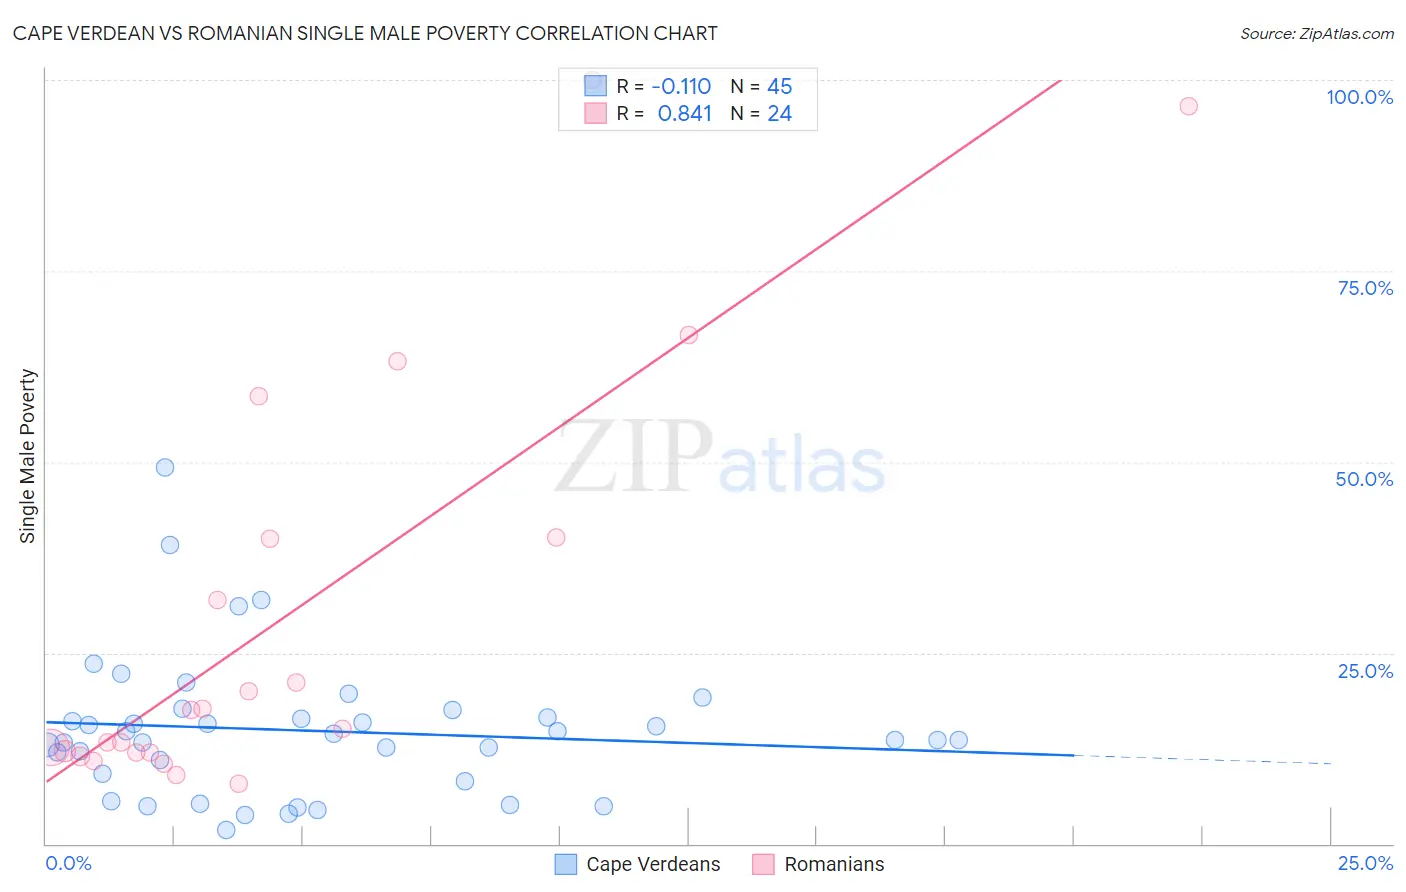
Cape Verdean vs Romanian Single Male Poverty Correlation Chart
The statistical analysis conducted on geographies consisting of 101,894,910 people shows a poor negative correlation between the proportion of Cape Verdeans and poverty level among single males in the United States with a correlation coefficient (R) of -0.110 and weighted average of 13.8%. Similarly, the statistical analysis conducted on geographies consisting of 331,496,845 people shows a very strong positive correlation between the proportion of Romanians and poverty level among single males in the United States with a correlation coefficient (R) of 0.841 and weighted average of 12.5%, a difference of 10.7%.
Single Male Poverty Correlation Summary
| Measurement | Cape Verdean | Romanian |
| Minimum | 1.7% | 7.9% |
| Maximum | 49.2% | 100.0% |
| Range | 47.5% | 92.1% |
| Mean | 14.8% | 29.7% |
| Median | 13.6% | 16.2% |
| Interquartile 25% (IQ1) | 8.7% | 12.0% |
| Interquartile 75% (IQ3) | 17.1% | 40.1% |
| Interquartile Range (IQR) | 8.4% | 28.1% |
| Standard Deviation (Sample) | 9.3% | 27.5% |
| Standard Deviation (Population) | 9.2% | 26.9% |
Similar Demographics by Single Male Poverty
Demographics Similar to Cape Verdeans by Single Male Poverty
In terms of single male poverty, the demographic groups most similar to Cape Verdeans are Fijian (13.8%, a difference of 0.12%), West Indian (13.8%, a difference of 0.19%), Hungarian (13.8%, a difference of 0.29%), Swiss (13.8%, a difference of 0.34%), and Immigrants from Congo (13.9%, a difference of 0.35%).
| Demographics | Rating | Rank | Single Male Poverty |
| Immigrants | Belize | 0.4 /100 | #256 | Tragic 13.7% |
| Immigrants | Central America | 0.3 /100 | #257 | Tragic 13.8% |
| Immigrants | Guatemala | 0.3 /100 | #258 | Tragic 13.8% |
| Guatemalans | 0.3 /100 | #259 | Tragic 13.8% |
| Swiss | 0.3 /100 | #260 | Tragic 13.8% |
| Hungarians | 0.3 /100 | #261 | Tragic 13.8% |
| Fijians | 0.3 /100 | #262 | Tragic 13.8% |
| Cape Verdeans | 0.2 /100 | #263 | Tragic 13.8% |
| West Indians | 0.2 /100 | #264 | Tragic 13.8% |
| Immigrants | Congo | 0.2 /100 | #265 | Tragic 13.9% |
| Immigrants | Cabo Verde | 0.1 /100 | #266 | Tragic 13.9% |
| Germans | 0.1 /100 | #267 | Tragic 13.9% |
| Immigrants | Mexico | 0.1 /100 | #268 | Tragic 13.9% |
| Scottish | 0.1 /100 | #269 | Tragic 14.0% |
| Immigrants | Saudi Arabia | 0.1 /100 | #270 | Tragic 14.0% |
Demographics Similar to Romanians by Single Male Poverty
In terms of single male poverty, the demographic groups most similar to Romanians are Immigrants from Netherlands (12.5%, a difference of 0.010%), Ecuadorian (12.5%, a difference of 0.050%), Immigrants from Jordan (12.5%, a difference of 0.080%), Immigrants from Sierra Leone (12.5%, a difference of 0.090%), and Russian (12.5%, a difference of 0.11%).
| Demographics | Rating | Rank | Single Male Poverty |
| Immigrants | Albania | 90.3 /100 | #119 | Exceptional 12.4% |
| Venezuelans | 89.4 /100 | #120 | Excellent 12.4% |
| Icelanders | 88.2 /100 | #121 | Excellent 12.5% |
| Serbians | 87.9 /100 | #122 | Excellent 12.5% |
| Immigrants | Kenya | 87.6 /100 | #123 | Excellent 12.5% |
| Russians | 87.3 /100 | #124 | Excellent 12.5% |
| Immigrants | Jordan | 87.1 /100 | #125 | Excellent 12.5% |
| Romanians | 86.4 /100 | #126 | Excellent 12.5% |
| Immigrants | Netherlands | 86.2 /100 | #127 | Excellent 12.5% |
| Ecuadorians | 85.9 /100 | #128 | Excellent 12.5% |
| Immigrants | Sierra Leone | 85.5 /100 | #129 | Excellent 12.5% |
| Immigrants | Nicaragua | 84.8 /100 | #130 | Excellent 12.5% |
| Immigrants | Northern Europe | 83.7 /100 | #131 | Excellent 12.5% |
| Salvadorans | 83.7 /100 | #132 | Excellent 12.5% |
| Immigrants | Western Asia | 83.4 /100 | #133 | Excellent 12.5% |