Cape Verdean vs Immigrants from Western Asia Female Poverty
COMPARE
Cape Verdean
Immigrants from Western Asia
Female Poverty
Female Poverty Comparison
Cape Verdeans
Immigrants from Western Asia
15.6%
FEMALE POVERTY
0.1/ 100
METRIC RATING
259th/ 347
METRIC RANK
13.9%
FEMALE POVERTY
20.7/ 100
METRIC RATING
203rd/ 347
METRIC RANK
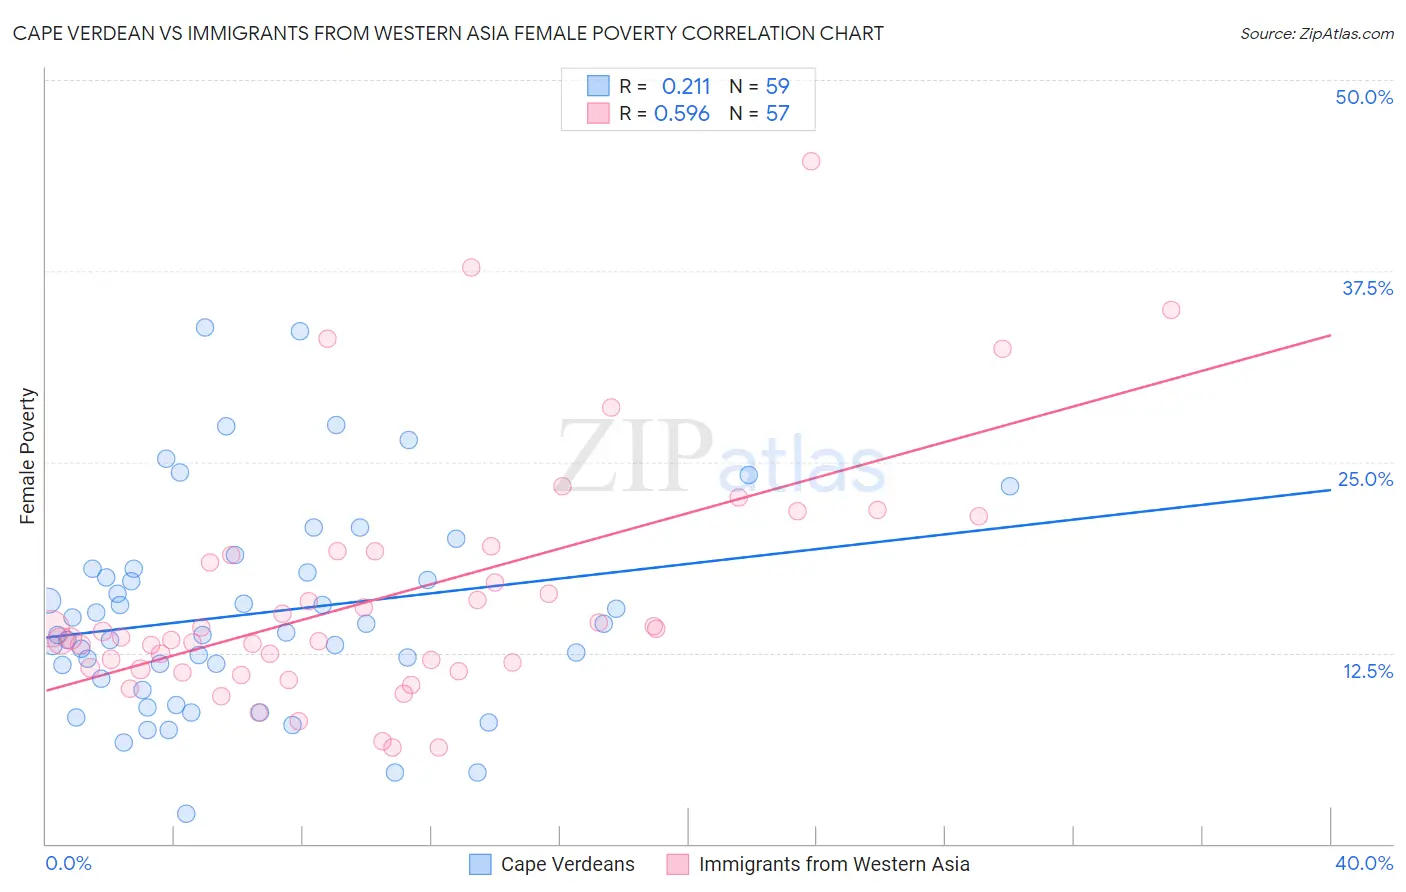
Cape Verdean vs Immigrants from Western Asia Female Poverty Correlation Chart
The statistical analysis conducted on geographies consisting of 107,541,318 people shows a weak positive correlation between the proportion of Cape Verdeans and poverty level among females in the United States with a correlation coefficient (R) of 0.211 and weighted average of 15.6%. Similarly, the statistical analysis conducted on geographies consisting of 404,121,163 people shows a substantial positive correlation between the proportion of Immigrants from Western Asia and poverty level among females in the United States with a correlation coefficient (R) of 0.596 and weighted average of 13.9%, a difference of 12.3%.
Female Poverty Correlation Summary
| Measurement | Cape Verdean | Immigrants from Western Asia |
| Minimum | 2.0% | 6.3% |
| Maximum | 33.8% | 44.7% |
| Range | 31.8% | 38.4% |
| Mean | 15.1% | 16.2% |
| Median | 13.8% | 13.5% |
| Interquartile 25% (IQ1) | 10.8% | 11.5% |
| Interquartile 75% (IQ3) | 18.0% | 19.0% |
| Interquartile Range (IQR) | 7.2% | 7.6% |
| Standard Deviation (Sample) | 6.7% | 7.8% |
| Standard Deviation (Population) | 6.7% | 7.8% |
Similar Demographics by Female Poverty
Demographics Similar to Cape Verdeans by Female Poverty
In terms of female poverty, the demographic groups most similar to Cape Verdeans are Immigrants from Guyana (15.6%, a difference of 0.080%), Shoshone (15.6%, a difference of 0.12%), Immigrants from Jamaica (15.6%, a difference of 0.18%), Guyanese (15.6%, a difference of 0.18%), and Mexican American Indian (15.6%, a difference of 0.18%).
| Demographics | Rating | Rank | Female Poverty |
| Immigrants | Burma/Myanmar | 0.3 /100 | #252 | Tragic 15.4% |
| Liberians | 0.2 /100 | #253 | Tragic 15.4% |
| Trinidadians and Tobagonians | 0.2 /100 | #254 | Tragic 15.4% |
| Ottawa | 0.2 /100 | #255 | Tragic 15.5% |
| Jamaicans | 0.2 /100 | #256 | Tragic 15.5% |
| Immigrants | Jamaica | 0.1 /100 | #257 | Tragic 15.6% |
| Shoshone | 0.1 /100 | #258 | Tragic 15.6% |
| Cape Verdeans | 0.1 /100 | #259 | Tragic 15.6% |
| Immigrants | Guyana | 0.1 /100 | #260 | Tragic 15.6% |
| Guyanese | 0.1 /100 | #261 | Tragic 15.6% |
| Mexican American Indians | 0.1 /100 | #262 | Tragic 15.6% |
| Cherokee | 0.1 /100 | #263 | Tragic 15.6% |
| Immigrants | Ecuador | 0.1 /100 | #264 | Tragic 15.6% |
| Immigrants | Liberia | 0.1 /100 | #265 | Tragic 15.7% |
| Immigrants | El Salvador | 0.1 /100 | #266 | Tragic 15.7% |
Demographics Similar to Immigrants from Western Asia by Female Poverty
In terms of female poverty, the demographic groups most similar to Immigrants from Western Asia are Hmong (13.9%, a difference of 0.050%), Immigrants from Kenya (13.9%, a difference of 0.060%), Spanish (13.9%, a difference of 0.10%), Spaniard (13.9%, a difference of 0.27%), and Immigrants from Lebanon (13.8%, a difference of 0.65%).
| Demographics | Rating | Rank | Female Poverty |
| South American Indians | 28.9 /100 | #196 | Fair 13.7% |
| Arabs | 28.6 /100 | #197 | Fair 13.7% |
| Immigrants | Uganda | 28.5 /100 | #198 | Fair 13.7% |
| Immigrants | Lebanon | 25.6 /100 | #199 | Fair 13.8% |
| Spanish | 21.4 /100 | #200 | Fair 13.9% |
| Immigrants | Kenya | 21.1 /100 | #201 | Fair 13.9% |
| Hmong | 21.1 /100 | #202 | Fair 13.9% |
| Immigrants | Western Asia | 20.7 /100 | #203 | Fair 13.9% |
| Spaniards | 18.9 /100 | #204 | Poor 13.9% |
| Ugandans | 15.4 /100 | #205 | Poor 14.0% |
| Immigrants | Uruguay | 14.0 /100 | #206 | Poor 14.0% |
| Immigrants | Eastern Africa | 9.0 /100 | #207 | Tragic 14.2% |
| Immigrants | Azores | 7.9 /100 | #208 | Tragic 14.2% |
| Panamanians | 7.7 /100 | #209 | Tragic 14.2% |
| Malaysians | 7.4 /100 | #210 | Tragic 14.3% |