Canadian vs Immigrants from Korea Seniors Poverty Over the Age of 65

COMPARE

Canadian
Race
Ancestry
AfghanAfricanAlaska NativeAlaskan AthabascanAlbanianAleutAlsatianAmericanApacheArabArapahoArgentineanArmenianAssyrian/Chaldean/SyriacAustralianAustrianBahamianBangladeshiBarbadianBasqueBelgianBelizeanBermudanBhutaneseBlackfeetBolivianBrazilianBritishBritish West IndianBulgarianBurmeseCajunCambodianCanadianCape VerdeanCarpatho RusynCelticCentral AmericanCentral American IndianCherokeeCheyenneChickasawChileanChineseChippewaChoctawColombianColvilleComancheCosta RicanCreeCreekCroatianCrowCubanCypriotCzechCzechoslovakianDanishDelawareDominicanDutchDutch West IndianEastern EuropeanEcuadorianEgyptianEnglishEstonianEthiopianEuropeanFijianFilipinoFinnishFrenchFrench American IndianFrench CanadianGermanGerman RussianGhanaianGreekGuamanian/ChamorroGuatemalanGuyaneseHaitianHmongHonduranHopiHoumaHungarianIcelanderIndian (Asian)IndonesianInupiatIranianIraqiIrishIroquoisIsraeliItalianJamaicanJapaneseJordanianKenyanKiowaKoreanLaotianLatvianLebaneseLiberianLithuanianLumbeeLuxembourgerMacedonianMalaysianMalteseMarshalleseMenomineeMexicanMexican American IndianMongolianMoroccanNative HawaiianNavajoNepaleseNew ZealanderNicaraguanNigerianNorthern EuropeanNorwegianOkinawanOsageOttawaPaiutePakistaniPalestinianPanamanianParaguayanPennsylvania GermanPeruvianPimaPolishPortuguesePotawatomiPuebloPuerto RicanPuget Sound SalishRomanianRussianSalvadoranSamoanScandinavianScotch-IrishScottishSeminoleSenegaleseSerbianShoshoneSierra LeoneanSiouxSlavicSlovakSloveneSomaliSouth AfricanSouth AmericanSouth American IndianSoviet UnionSpaniardSpanishSpanish AmericanSpanish American IndianSri LankanSubsaharan AfricanSudaneseSwedishSwissSyrianTaiwaneseThaiTlingit-HaidaTohono O'OdhamTonganTrinidadian and TobagonianTsimshianTurkishU.S. Virgin IslanderUgandanUkrainianUruguayanUteVenezuelanVietnameseWelshWest IndianYakamaYaquiYugoslavianYumanYup'ikZimbabwean
Immigration
NonimmigrantsImmigrantsAfghanistanAfricaAlbaniaArgentinaArmeniaAsiaAustraliaAustriaBahamasBangladeshBarbadosBelarusBelgiumBelizeBoliviaBosnia and HerzegovinaBrazilBulgariaBurma/MyanmarCabo VerdeCambodiaCameroonCanadaCaribbeanCentral AmericaChileChinaColombiaCongoCosta RicaCroatiaCubaCzechoslovakiaDenmarkDominicaDominican RepublicEastern AfricaEastern AsiaEastern EuropeEcuadorEgyptEl SalvadorEnglandEritreaEthiopiaEuropeFijiFranceGermanyGhanaGreeceGrenadaGuatemalaGuyanaHaitiHondurasHong KongHungaryIndiaIndonesiaIranIraqIrelandIsraelItalyJamaicaJapanJordanKazakhstanKenyaKuwaitLaosLatin AmericaLatviaLebanonLiberiaLithuaniaMalaysiaMexicoMicronesiaMiddle AfricaMoldovaMoroccoNepalNetherlandsNicaraguaNigeriaNorth AmericaNorth MacedoniaNorthern AfricaNorthern EuropeNorwayOceaniaPakistanPanamaPeruPhilippinesPolandPortugalRomaniaRussiaSaudi ArabiaScotlandSenegalSerbiaSierra LeoneSingaporeSomaliaSouth AfricaSouth AmericaSouth Central AsiaSouth Eastern AsiaSouthern EuropeSpainSri LankaSt. Vincent and the GrenadinesSudanSwedenSwitzerlandSyriaTaiwanThailandTrinidad and TobagoTurkeyUgandaUkraineUruguayUzbekistanVenezuelaVietnamWest IndiesWestern AfricaWestern AsiaWestern EuropeYemenZaireZimbabweAzores
Immigrants from Korea
Race
Ancestry
AfghanAfricanAlaska NativeAlaskan AthabascanAlbanianAleutAlsatianAmericanApacheArabArapahoArgentineanArmenianAssyrian/Chaldean/SyriacAustralianAustrianBahamianBangladeshiBarbadianBasqueBelgianBelizeanBermudanBhutaneseBlackfeetBolivianBrazilianBritishBritish West IndianBulgarianBurmeseCajunCambodianCape VerdeanCarpatho RusynCelticCentral AmericanCentral American IndianCherokeeCheyenneChickasawChileanChineseChippewaChoctawColombianColvilleComancheCosta RicanCreeCreekCroatianCrowCubanCypriotCzechCzechoslovakianDanishDelawareDominicanDutchDutch West IndianEastern EuropeanEcuadorianEgyptianEnglishEstonianEthiopianEuropeanFijianFilipinoFinnishFrenchFrench American IndianFrench CanadianGermanGerman RussianGhanaianGreekGuamanian/ChamorroGuatemalanGuyaneseHaitianHmongHonduranHopiHoumaHungarianIcelanderIndian (Asian)IndonesianInupiatIranianIraqiIrishIroquoisIsraeliItalianJamaicanJapaneseJordanianKenyanKiowaKoreanLaotianLatvianLebaneseLiberianLithuanianLumbeeLuxembourgerMacedonianMalaysianMalteseMarshalleseMenomineeMexicanMexican American IndianMongolianMoroccanNative HawaiianNavajoNepaleseNew ZealanderNicaraguanNigerianNorthern EuropeanNorwegianOkinawanOsageOttawaPaiutePakistaniPalestinianPanamanianParaguayanPennsylvania GermanPeruvianPimaPolishPortuguesePotawatomiPuebloPuerto RicanPuget Sound SalishRomanianRussianSalvadoranSamoanScandinavianScotch-IrishScottishSeminoleSenegaleseSerbianShoshoneSierra LeoneanSiouxSlavicSlovakSloveneSomaliSouth AfricanSouth AmericanSouth American IndianSoviet UnionSpaniardSpanishSpanish AmericanSpanish American IndianSri LankanSubsaharan AfricanSudaneseSwedishSwissSyrianTaiwaneseThaiTlingit-HaidaTohono O'OdhamTonganTrinidadian and TobagonianTsimshianTurkishU.S. Virgin IslanderUgandanUkrainianUruguayanUteVenezuelanVietnameseWelshWest IndianYakamaYaquiYugoslavianYumanYup'ikZimbabwean
Immigration
NonimmigrantsImmigrantsAfghanistanAfricaAlbaniaArgentinaArmeniaAsiaAustraliaAustriaBahamasBangladeshBarbadosBelarusBelgiumBelizeBoliviaBosnia and HerzegovinaBrazilBulgariaBurma/MyanmarCabo VerdeCambodiaCameroonCanadaCaribbeanCentral AmericaChileChinaColombiaCongoCosta RicaCroatiaCubaCzechoslovakiaDenmarkDominicaDominican RepublicEastern AfricaEastern AsiaEastern EuropeEcuadorEgyptEl SalvadorEnglandEritreaEthiopiaEuropeFijiFranceGermanyGhanaGreeceGrenadaGuatemalaGuyanaHaitiHondurasHong KongHungaryIndiaIndonesiaIranIraqIrelandIsraelItalyJamaicaJapanJordanKazakhstanKenyaKoreaKuwaitLaosLatin AmericaLatviaLebanonLiberiaLithuaniaMalaysiaMexicoMicronesiaMiddle AfricaMoldovaMoroccoNepalNetherlandsNicaraguaNigeriaNorth AmericaNorth MacedoniaNorthern AfricaNorthern EuropeNorwayOceaniaPakistanPanamaPeruPhilippinesPolandPortugalRomaniaRussiaSaudi ArabiaScotlandSenegalSerbiaSierra LeoneSingaporeSomaliaSouth AfricaSouth AmericaSouth Central AsiaSouth Eastern AsiaSouthern EuropeSpainSri LankaSt. Vincent and the GrenadinesSudanSwedenSwitzerlandSyriaTaiwanThailandTrinidad and TobagoTurkeyUgandaUkraineUruguayUzbekistanVenezuelaVietnamWest IndiesWestern AfricaWestern AsiaWestern EuropeYemenZaireZimbabweAzores
Seniors Poverty Over the Age of 65
Income
Poverty
Unemployment
Labor Participation
Family Structure
Vehicle Availability
Education Level
Disability

Seniors Poverty Over the Age of 65 Comparison

Canadians

Immigrants from Korea

Exceptional
Exceptional
9.9%
SENIORS POVERTY OVER THE AGE OF 65
98.5/ 100
METRIC RATING
68th/ 347
METRIC RANK
10.3%
SENIORS POVERTY OVER THE AGE OF 65
93.3/ 100
METRIC RATING
112th/ 347
METRIC RANK

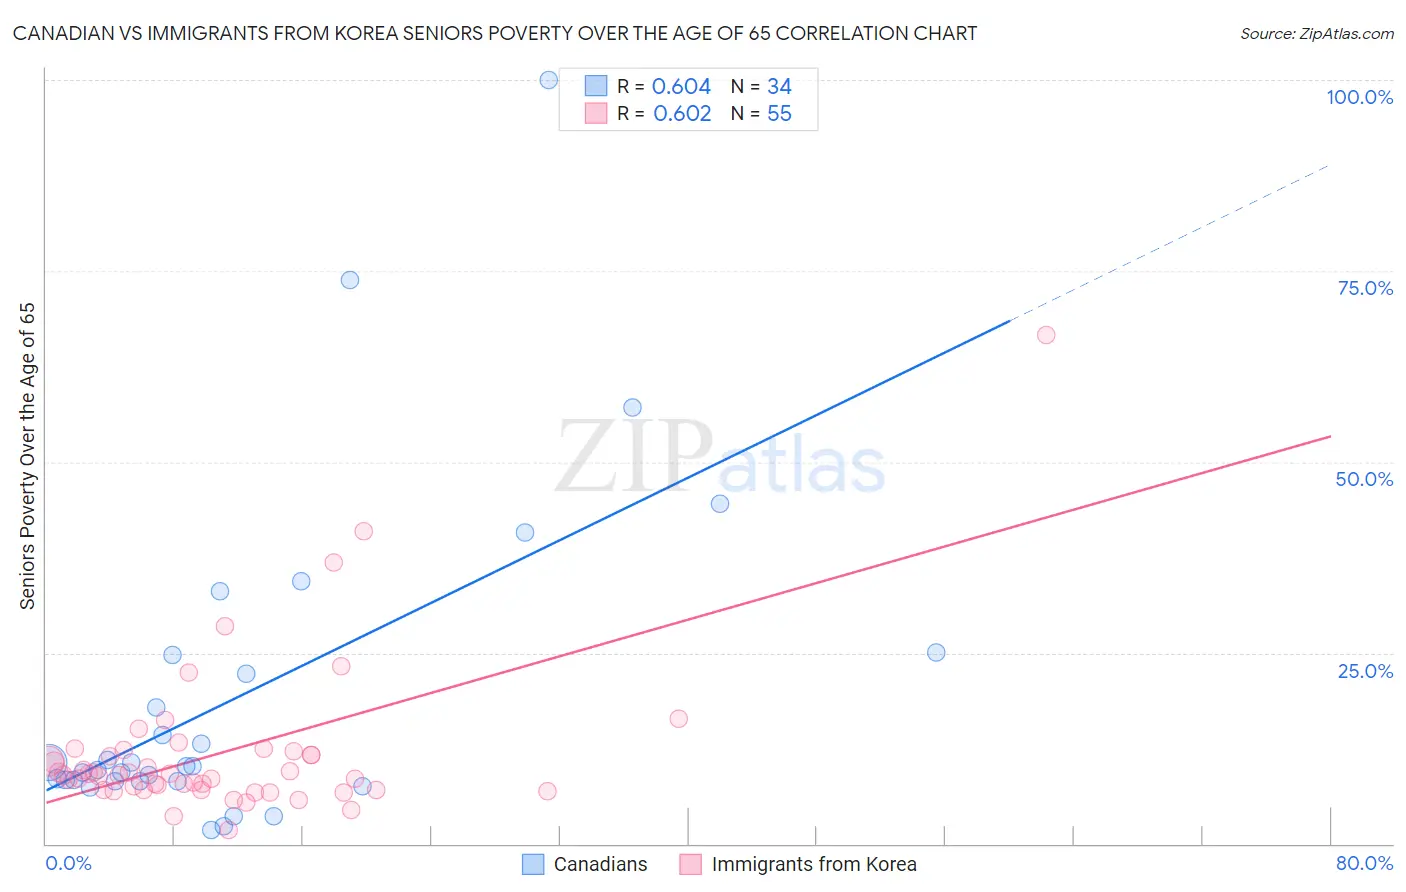
Canadian vs Immigrants from Korea Seniors Poverty Over the Age of 65 Correlation Chart

The statistical analysis conducted on geographies consisting of 435,688,797 people shows a significant positive correlation between the proportion of Canadians and poverty level among seniors over the age of 65 in the United States with a correlation coefficient (R) of 0.604 and weighted average of 9.9%. Similarly, the statistical analysis conducted on geographies consisting of 414,371,248 people shows a significant positive correlation between the proportion of Immigrants from Korea and poverty level among seniors over the age of 65 in the United States with a correlation coefficient (R) of 0.602 and weighted average of 10.3%, a difference of 3.7%.
Canadian vs Immigrants from Korea Seniors Poverty Over the Age of 65

Seniors Poverty Over the Age of 65 Correlation Summary

MeasurementCanadianImmigrants from Korea
Minimum1.7%1.8%
Maximum100.0%66.7%
Range98.3%64.8%
Mean19.6%11.9%
Median10.2%9.0%
Interquartile 25% (IQ1)8.2%7.1%
Interquartile 75% (IQ3)24.6%12.1%
Interquartile Range (IQR)16.4%5.1%
Standard Deviation (Sample)21.6%10.4%
Standard Deviation (Population)21.3%10.3%

Similar Demographics by Seniors Poverty Over the Age of 65

Demographics Similar to Canadians by Seniors Poverty Over the Age of 65

In terms of seniors poverty over the age of 65, the demographic groups most similar to Canadians are Australian (9.9%, a difference of 0.16%), Immigrants from Austria (9.9%, a difference of 0.22%), Immigrants from Netherlands (9.9%, a difference of 0.32%), Pennsylvania German (9.9%, a difference of 0.37%), and Immigrants from North America (9.9%, a difference of 0.66%).
DemographicsRating | RankSeniors Poverty Over the Age of 65
Iranians
98.9
/100
|
#61
Exceptional
9.8%
French Canadians
98.9
/100
|
#62
Exceptional
9.8%
Macedonians
98.8
/100
|
#63
Exceptional
9.9%
Immigrants | North America
98.8
/100
|
#64
Exceptional
9.9%
Pennsylvania Germans
98.7
/100
|
#65
Exceptional
9.9%
Immigrants | Netherlands
98.7
/100
|
#66
Exceptional
9.9%
Immigrants | Austria
98.6
/100
|
#67
Exceptional
9.9%
Canadians
98.5
/100
|
#68
Exceptional
9.9%
Australians
98.4
/100
|
#69
Exceptional
9.9%
Samoans
98.0
/100
|
#70
Exceptional
10.0%
Yugoslavians
97.9
/100
|
#71
Exceptional
10.0%
Palestinians
97.9
/100
|
#72
Exceptional
10.0%
Russians
97.9
/100
|
#73
Exceptional
10.0%
Turks
97.9
/100
|
#74
Exceptional
10.0%
Immigrants | Czechoslovakia
97.8
/100
|
#75
Exceptional
10.0%

Demographics Similar to Immigrants from Korea by Seniors Poverty Over the Age of 65

In terms of seniors poverty over the age of 65, the demographic groups most similar to Immigrants from Korea are Immigrants from Belgium (10.3%, a difference of 0.020%), Immigrants from Romania (10.3%, a difference of 0.040%), Immigrants from Zimbabwe (10.3%, a difference of 0.060%), Syrian (10.3%, a difference of 0.20%), and Immigrants from Croatia (10.3%, a difference of 0.22%).
DemographicsRating | RankSeniors Poverty Over the Age of 65
Aleuts
94.1
/100
|
#105
Exceptional
10.3%
Kenyans
94.1
/100
|
#106
Exceptional
10.3%
Hawaiians
93.9
/100
|
#107
Exceptional
10.3%
Immigrants | Croatia
93.9
/100
|
#108
Exceptional
10.3%
Syrians
93.8
/100
|
#109
Exceptional
10.3%
Immigrants | Zimbabwe
93.5
/100
|
#110
Exceptional
10.3%
Immigrants | Belgium
93.4
/100
|
#111
Exceptional
10.3%
Immigrants | Korea
93.3
/100
|
#112
Exceptional
10.3%
Immigrants | Romania
93.3
/100
|
#113
Exceptional
10.3%
Immigrants | Denmark
92.7
/100
|
#114
Exceptional
10.3%
Immigrants | Italy
92.6
/100
|
#115
Exceptional
10.3%
Pakistanis
92.2
/100
|
#116
Exceptional
10.3%
Lebanese
92.0
/100
|
#117
Exceptional
10.3%
Okinawans
91.7
/100
|
#118
Exceptional
10.4%
Immigrants | Western Europe
91.1
/100
|
#119
Exceptional
10.4%