Cajun vs Immigrants from Africa Female Poverty
COMPARE
Cajun
Immigrants from Africa
Female Poverty
Female Poverty Comparison
Cajuns
Immigrants from Africa
17.5%
FEMALE POVERTY
0.0/ 100
METRIC RATING
319th/ 347
METRIC RANK
14.5%
FEMALE POVERTY
3.3/ 100
METRIC RATING
223rd/ 347
METRIC RANK
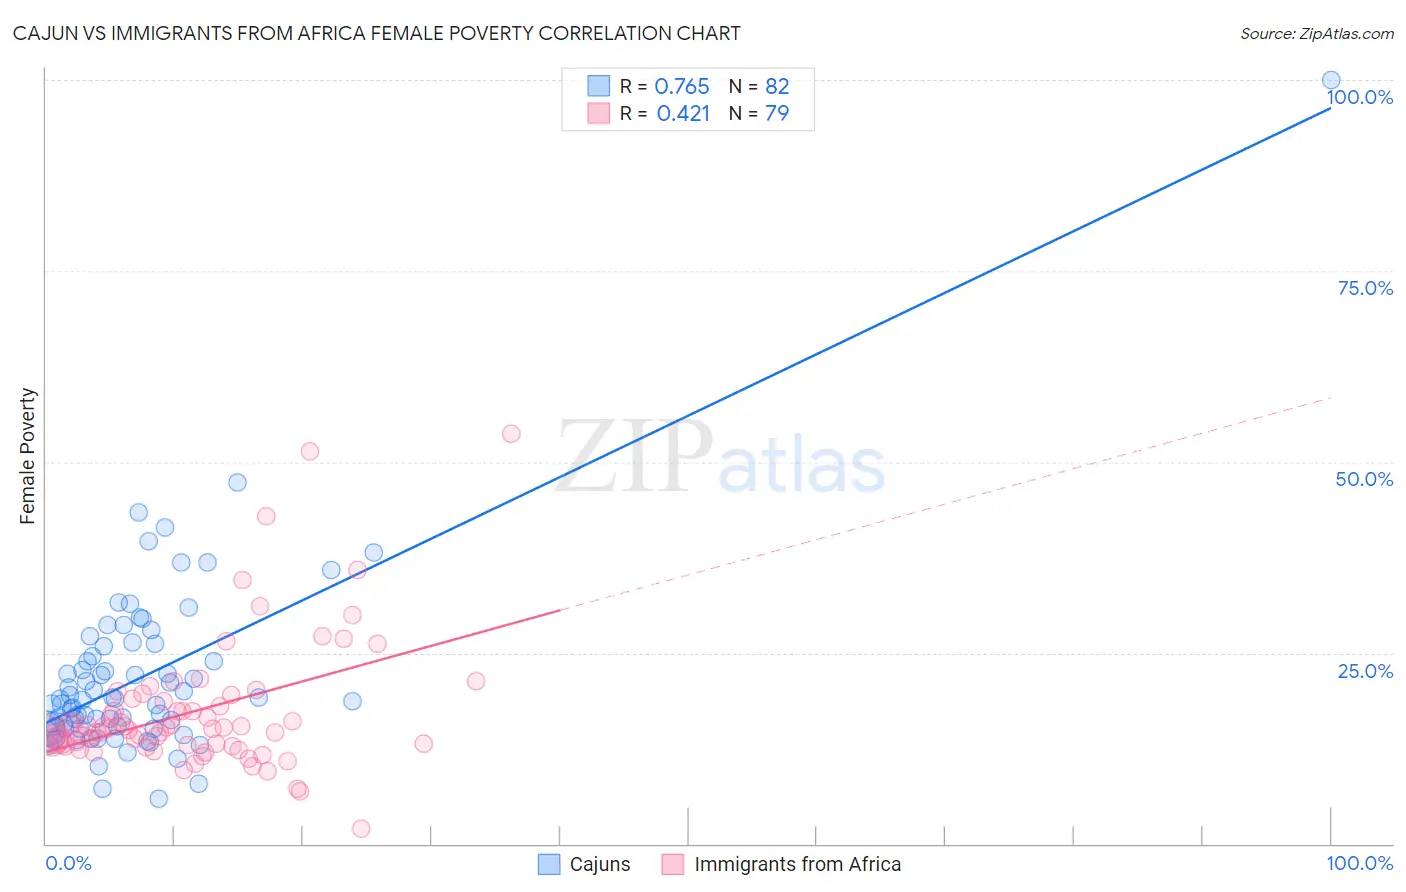
Cajun vs Immigrants from Africa Female Poverty Correlation Chart
The statistical analysis conducted on geographies consisting of 149,687,613 people shows a strong positive correlation between the proportion of Cajuns and poverty level among females in the United States with a correlation coefficient (R) of 0.765 and weighted average of 17.5%. Similarly, the statistical analysis conducted on geographies consisting of 468,810,644 people shows a moderate positive correlation between the proportion of Immigrants from Africa and poverty level among females in the United States with a correlation coefficient (R) of 0.421 and weighted average of 14.5%, a difference of 20.1%.
Female Poverty Correlation Summary
| Measurement | Cajun | Immigrants from Africa |
| Minimum | 5.9% | 1.9% |
| Maximum | 100.0% | 53.6% |
| Range | 94.1% | 51.7% |
| Mean | 21.9% | 17.4% |
| Median | 18.9% | 15.1% |
| Interquartile 25% (IQ1) | 15.1% | 12.9% |
| Interquartile 75% (IQ3) | 25.9% | 19.0% |
| Interquartile Range (IQR) | 10.8% | 6.1% |
| Standard Deviation (Sample) | 12.1% | 8.7% |
| Standard Deviation (Population) | 12.1% | 8.6% |
Similar Demographics by Female Poverty
Demographics Similar to Cajuns by Female Poverty
In terms of female poverty, the demographic groups most similar to Cajuns are Ute (17.5%, a difference of 0.010%), Immigrants from Dominica (17.5%, a difference of 0.080%), Arapaho (17.5%, a difference of 0.15%), Immigrants from Congo (17.4%, a difference of 0.34%), and Honduran (17.4%, a difference of 0.53%).
| Demographics | Rating | Rank | Female Poverty |
| Immigrants | Somalia | 0.0 /100 | #312 | Tragic 17.0% |
| British West Indians | 0.0 /100 | #313 | Tragic 17.0% |
| Dutch West Indians | 0.0 /100 | #314 | Tragic 17.1% |
| U.S. Virgin Islanders | 0.0 /100 | #315 | Tragic 17.3% |
| Hondurans | 0.0 /100 | #316 | Tragic 17.4% |
| Immigrants | Congo | 0.0 /100 | #317 | Tragic 17.4% |
| Ute | 0.0 /100 | #318 | Tragic 17.5% |
| Cajuns | 0.0 /100 | #319 | Tragic 17.5% |
| Immigrants | Dominica | 0.0 /100 | #320 | Tragic 17.5% |
| Arapaho | 0.0 /100 | #321 | Tragic 17.5% |
| Menominee | 0.0 /100 | #322 | Tragic 17.6% |
| Paiute | 0.0 /100 | #323 | Tragic 17.7% |
| Immigrants | Honduras | 0.0 /100 | #324 | Tragic 17.7% |
| Colville | 0.0 /100 | #325 | Tragic 17.8% |
| Central American Indians | 0.0 /100 | #326 | Tragic 18.0% |
Demographics Similar to Immigrants from Africa by Female Poverty
In terms of female poverty, the demographic groups most similar to Immigrants from Africa are Nonimmigrants (14.5%, a difference of 0.23%), Immigrants from Cambodia (14.5%, a difference of 0.26%), American (14.6%, a difference of 0.39%), Immigrants from Micronesia (14.6%, a difference of 0.40%), and Alsatian (14.5%, a difference of 0.45%).
| Demographics | Rating | Rank | Female Poverty |
| Immigrants | Thailand | 4.5 /100 | #216 | Tragic 14.4% |
| Immigrants | Immigrants | 4.5 /100 | #217 | Tragic 14.4% |
| Immigrants | Uzbekistan | 4.4 /100 | #218 | Tragic 14.4% |
| Japanese | 4.1 /100 | #219 | Tragic 14.5% |
| Alsatians | 4.0 /100 | #220 | Tragic 14.5% |
| Immigrants | Cambodia | 3.7 /100 | #221 | Tragic 14.5% |
| Immigrants | Nonimmigrants | 3.7 /100 | #222 | Tragic 14.5% |
| Immigrants | Africa | 3.3 /100 | #223 | Tragic 14.5% |
| Americans | 2.8 /100 | #224 | Tragic 14.6% |
| Immigrants | Micronesia | 2.8 /100 | #225 | Tragic 14.6% |
| Immigrants | Eritrea | 2.4 /100 | #226 | Tragic 14.6% |
| Immigrants | Nigeria | 2.1 /100 | #227 | Tragic 14.7% |
| German Russians | 2.0 /100 | #228 | Tragic 14.7% |
| Ghanaians | 1.9 /100 | #229 | Tragic 14.7% |
| Alaska Natives | 1.8 /100 | #230 | Tragic 14.7% |