Cajun vs Greek Family Poverty
COMPARE
Cajun
Greek
Family Poverty
Family Poverty Comparison
Cajuns
Greeks
11.9%
FAMILY POVERTY
0.0/ 100
METRIC RATING
306th/ 347
METRIC RANK
7.5%
FAMILY POVERTY
99.4/ 100
METRIC RATING
35th/ 347
METRIC RANK
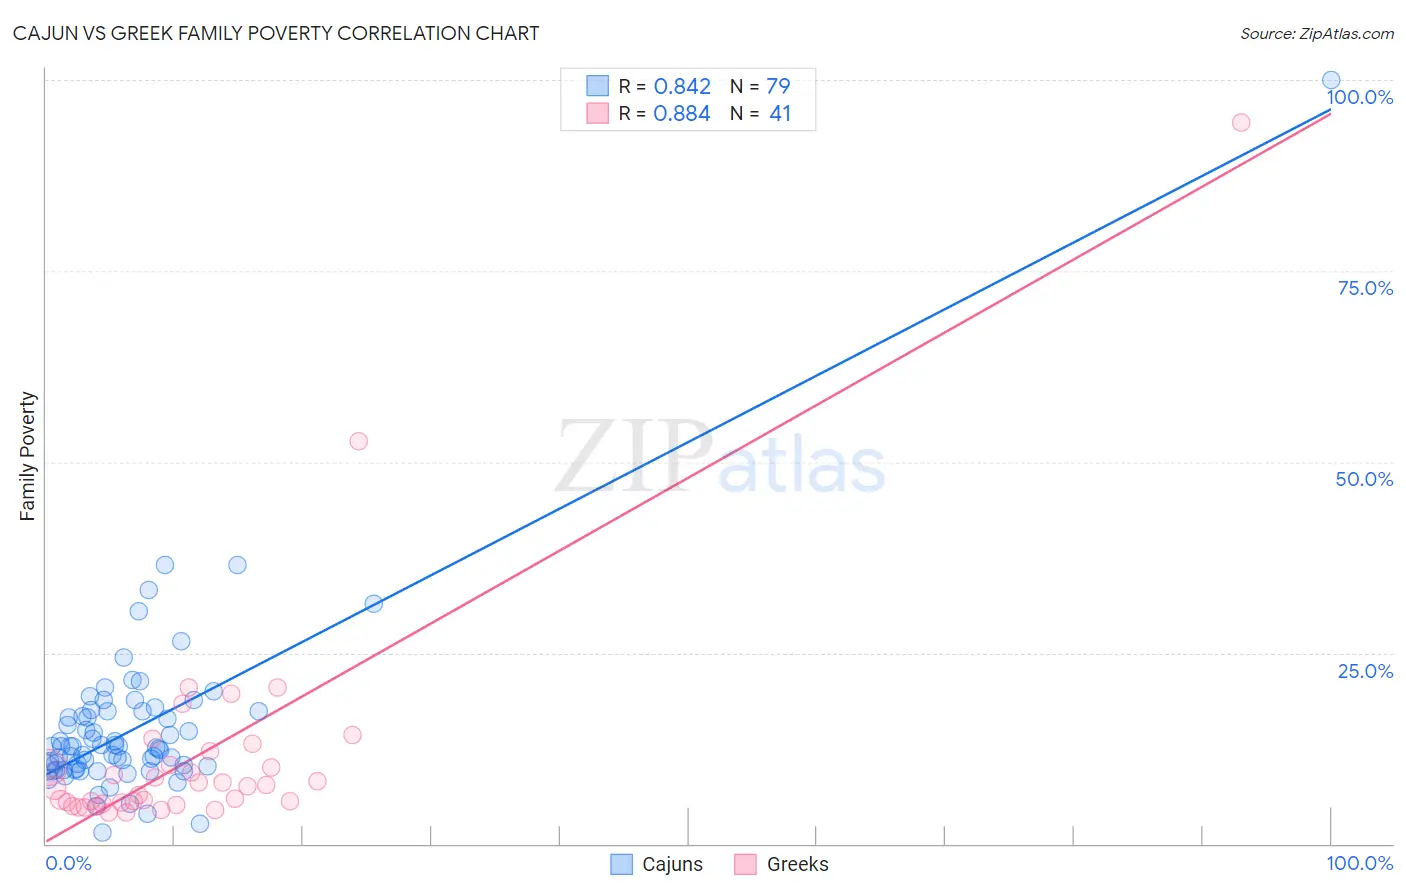
Cajun vs Greek Family Poverty Correlation Chart
The statistical analysis conducted on geographies consisting of 149,591,536 people shows a very strong positive correlation between the proportion of Cajuns and poverty level among families in the United States with a correlation coefficient (R) of 0.842 and weighted average of 11.9%. Similarly, the statistical analysis conducted on geographies consisting of 480,426,664 people shows a very strong positive correlation between the proportion of Greeks and poverty level among families in the United States with a correlation coefficient (R) of 0.884 and weighted average of 7.5%, a difference of 58.3%.
Family Poverty Correlation Summary
| Measurement | Cajun | Greek |
| Minimum | 1.5% | 4.1% |
| Maximum | 100.0% | 94.4% |
| Range | 98.5% | 90.3% |
| Mean | 15.2% | 11.7% |
| Median | 12.7% | 7.5% |
| Interquartile 25% (IQ1) | 9.9% | 5.3% |
| Interquartile 75% (IQ3) | 17.4% | 11.2% |
| Interquartile Range (IQR) | 7.5% | 5.9% |
| Standard Deviation (Sample) | 11.9% | 15.6% |
| Standard Deviation (Population) | 11.8% | 15.4% |
Similar Demographics by Family Poverty
Demographics Similar to Cajuns by Family Poverty
In terms of family poverty, the demographic groups most similar to Cajuns are Immigrants from Congo (11.9%, a difference of 0.11%), Seminole (11.9%, a difference of 0.17%), Mexican (11.8%, a difference of 0.56%), Hispanic or Latino (12.0%, a difference of 0.61%), and Immigrants from Guatemala (12.0%, a difference of 0.62%).
| Demographics | Rating | Rank | Family Poverty |
| Dutch West Indians | 0.0 /100 | #299 | Tragic 11.7% |
| Immigrants | Bangladesh | 0.0 /100 | #300 | Tragic 11.7% |
| Bahamians | 0.0 /100 | #301 | Tragic 11.7% |
| Guatemalans | 0.0 /100 | #302 | Tragic 11.7% |
| Africans | 0.0 /100 | #303 | Tragic 11.8% |
| Immigrants | Latin America | 0.0 /100 | #304 | Tragic 11.8% |
| Mexicans | 0.0 /100 | #305 | Tragic 11.8% |
| Cajuns | 0.0 /100 | #306 | Tragic 11.9% |
| Immigrants | Congo | 0.0 /100 | #307 | Tragic 11.9% |
| Seminole | 0.0 /100 | #308 | Tragic 11.9% |
| Hispanics or Latinos | 0.0 /100 | #309 | Tragic 12.0% |
| Immigrants | Guatemala | 0.0 /100 | #310 | Tragic 12.0% |
| Ute | 0.0 /100 | #311 | Tragic 12.1% |
| Immigrants | Central America | 0.0 /100 | #312 | Tragic 12.1% |
| Immigrants | Caribbean | 0.0 /100 | #313 | Tragic 12.2% |
Demographics Similar to Greeks by Family Poverty
In terms of family poverty, the demographic groups most similar to Greeks are Turkish (7.5%, a difference of 0.010%), Estonian (7.5%, a difference of 0.18%), Bolivian (7.5%, a difference of 0.43%), Carpatho Rusyn (7.5%, a difference of 0.49%), and Slovene (7.5%, a difference of 0.52%).
| Demographics | Rating | Rank | Family Poverty |
| Immigrants | Korea | 99.6 /100 | #28 | Exceptional 7.4% |
| Immigrants | Northern Europe | 99.6 /100 | #29 | Exceptional 7.4% |
| Italians | 99.6 /100 | #30 | Exceptional 7.4% |
| Czechs | 99.6 /100 | #31 | Exceptional 7.4% |
| Poles | 99.5 /100 | #32 | Exceptional 7.4% |
| Immigrants | Japan | 99.5 /100 | #33 | Exceptional 7.4% |
| Russians | 99.5 /100 | #34 | Exceptional 7.5% |
| Greeks | 99.4 /100 | #35 | Exceptional 7.5% |
| Turks | 99.4 /100 | #36 | Exceptional 7.5% |
| Estonians | 99.4 /100 | #37 | Exceptional 7.5% |
| Bolivians | 99.3 /100 | #38 | Exceptional 7.5% |
| Carpatho Rusyns | 99.3 /100 | #39 | Exceptional 7.5% |
| Slovenes | 99.3 /100 | #40 | Exceptional 7.5% |
| Immigrants | Australia | 99.2 /100 | #41 | Exceptional 7.6% |
| Scandinavians | 99.1 /100 | #42 | Exceptional 7.6% |