Burmese vs Immigrants from Norway Child Poverty Among Boys Under 16

COMPARE

Burmese
Race
Ancestry
AfghanAfricanAlaska NativeAlaskan AthabascanAlbanianAleutAlsatianAmericanApacheArabArapahoArgentineanArmenianAssyrian/Chaldean/SyriacAustralianAustrianBahamianBangladeshiBarbadianBasqueBelgianBelizeanBermudanBhutaneseBlackfeetBolivianBrazilianBritishBritish West IndianBulgarianBurmeseCajunCambodianCanadianCape VerdeanCarpatho RusynCelticCentral AmericanCentral American IndianCherokeeCheyenneChickasawChileanChineseChippewaChoctawColombianColvilleComancheCosta RicanCreeCreekCroatianCrowCubanCypriotCzechCzechoslovakianDanishDelawareDominicanDutchDutch West IndianEastern EuropeanEcuadorianEgyptianEnglishEstonianEthiopianEuropeanFijianFilipinoFinnishFrenchFrench American IndianFrench CanadianGermanGerman RussianGhanaianGreekGuamanian/ChamorroGuatemalanGuyaneseHaitianHmongHonduranHopiHoumaHungarianIcelanderIndian (Asian)IndonesianInupiatIranianIraqiIrishIroquoisIsraeliItalianJamaicanJapaneseJordanianKenyanKiowaKoreanLaotianLatvianLebaneseLiberianLithuanianLumbeeLuxembourgerMacedonianMalaysianMalteseMarshalleseMenomineeMexicanMexican American IndianMongolianMoroccanNative HawaiianNavajoNepaleseNew ZealanderNicaraguanNigerianNorthern EuropeanNorwegianOkinawanOsageOttawaPaiutePakistaniPalestinianPanamanianParaguayanPennsylvania GermanPeruvianPimaPolishPortuguesePotawatomiPuebloPuerto RicanPuget Sound SalishRomanianRussianSalvadoranSamoanScandinavianScotch-IrishScottishSeminoleSenegaleseSerbianShoshoneSierra LeoneanSiouxSlavicSlovakSloveneSomaliSouth AfricanSouth AmericanSouth American IndianSoviet UnionSpaniardSpanishSpanish AmericanSpanish American IndianSri LankanSubsaharan AfricanSudaneseSwedishSwissSyrianTaiwaneseThaiTlingit-HaidaTohono O'OdhamTonganTrinidadian and TobagonianTsimshianTurkishU.S. Virgin IslanderUgandanUkrainianUruguayanUteVenezuelanVietnameseWelshWest IndianYakamaYaquiYugoslavianYumanYup'ikZimbabwean
Immigration
NonimmigrantsImmigrantsAfghanistanAfricaAlbaniaArgentinaArmeniaAsiaAustraliaAustriaBahamasBangladeshBarbadosBelarusBelgiumBelizeBoliviaBosnia and HerzegovinaBrazilBulgariaBurma/MyanmarCabo VerdeCambodiaCameroonCanadaCaribbeanCentral AmericaChileChinaColombiaCongoCosta RicaCroatiaCubaCzechoslovakiaDenmarkDominicaDominican RepublicEastern AfricaEastern AsiaEastern EuropeEcuadorEgyptEl SalvadorEnglandEritreaEthiopiaEuropeFijiFranceGermanyGhanaGreeceGrenadaGuatemalaGuyanaHaitiHondurasHong KongHungaryIndiaIndonesiaIranIraqIrelandIsraelItalyJamaicaJapanJordanKazakhstanKenyaKoreaKuwaitLaosLatin AmericaLatviaLebanonLiberiaLithuaniaMalaysiaMexicoMicronesiaMiddle AfricaMoldovaMoroccoNepalNetherlandsNicaraguaNigeriaNorth AmericaNorth MacedoniaNorthern AfricaNorthern EuropeOceaniaPakistanPanamaPeruPhilippinesPolandPortugalRomaniaRussiaSaudi ArabiaScotlandSenegalSerbiaSierra LeoneSingaporeSomaliaSouth AfricaSouth AmericaSouth Central AsiaSouth Eastern AsiaSouthern EuropeSpainSri LankaSt. Vincent and the GrenadinesSudanSwedenSwitzerlandSyriaTaiwanThailandTrinidad and TobagoTurkeyUgandaUkraineUruguayUzbekistanVenezuelaVietnamWest IndiesWestern AfricaWestern AsiaWestern EuropeYemenZaireZimbabweAzores
Immigrants from Norway
Race
Ancestry
AfghanAfricanAlaska NativeAlaskan AthabascanAlbanianAleutAlsatianAmericanApacheArabArapahoArgentineanArmenianAssyrian/Chaldean/SyriacAustralianAustrianBahamianBangladeshiBarbadianBasqueBelgianBelizeanBermudanBhutaneseBlackfeetBolivianBrazilianBritishBritish West IndianBulgarianCajunCambodianCanadianCape VerdeanCarpatho RusynCelticCentral AmericanCentral American IndianCherokeeCheyenneChickasawChileanChineseChippewaChoctawColombianColvilleComancheCosta RicanCreeCreekCroatianCrowCubanCypriotCzechCzechoslovakianDanishDelawareDominicanDutchDutch West IndianEastern EuropeanEcuadorianEgyptianEnglishEstonianEthiopianEuropeanFijianFilipinoFinnishFrenchFrench American IndianFrench CanadianGermanGerman RussianGhanaianGreekGuamanian/ChamorroGuatemalanGuyaneseHaitianHmongHonduranHopiHoumaHungarianIcelanderIndian (Asian)IndonesianInupiatIranianIraqiIrishIroquoisIsraeliItalianJamaicanJapaneseJordanianKenyanKiowaKoreanLaotianLatvianLebaneseLiberianLithuanianLumbeeLuxembourgerMacedonianMalaysianMalteseMarshalleseMenomineeMexicanMexican American IndianMongolianMoroccanNative HawaiianNavajoNepaleseNew ZealanderNicaraguanNigerianNorthern EuropeanNorwegianOkinawanOsageOttawaPaiutePakistaniPalestinianPanamanianParaguayanPennsylvania GermanPeruvianPimaPolishPortuguesePotawatomiPuebloPuerto RicanPuget Sound SalishRomanianRussianSalvadoranSamoanScandinavianScotch-IrishScottishSeminoleSenegaleseSerbianShoshoneSierra LeoneanSiouxSlavicSlovakSloveneSomaliSouth AfricanSouth AmericanSouth American IndianSoviet UnionSpaniardSpanishSpanish AmericanSpanish American IndianSri LankanSubsaharan AfricanSudaneseSwedishSwissSyrianTaiwaneseThaiTlingit-HaidaTohono O'OdhamTonganTrinidadian and TobagonianTsimshianTurkishU.S. Virgin IslanderUgandanUkrainianUruguayanUteVenezuelanVietnameseWelshWest IndianYakamaYaquiYugoslavianYumanYup'ikZimbabwean
Immigration
NonimmigrantsImmigrantsAfghanistanAfricaAlbaniaArgentinaArmeniaAsiaAustraliaAustriaBahamasBangladeshBarbadosBelarusBelgiumBelizeBoliviaBosnia and HerzegovinaBrazilBulgariaBurma/MyanmarCabo VerdeCambodiaCameroonCanadaCaribbeanCentral AmericaChileChinaColombiaCongoCosta RicaCroatiaCubaCzechoslovakiaDenmarkDominicaDominican RepublicEastern AfricaEastern AsiaEastern EuropeEcuadorEgyptEl SalvadorEnglandEritreaEthiopiaEuropeFijiFranceGermanyGhanaGreeceGrenadaGuatemalaGuyanaHaitiHondurasHong KongHungaryIndiaIndonesiaIranIraqIrelandIsraelItalyJamaicaJapanJordanKazakhstanKenyaKoreaKuwaitLaosLatin AmericaLatviaLebanonLiberiaLithuaniaMalaysiaMexicoMicronesiaMiddle AfricaMoldovaMoroccoNepalNetherlandsNicaraguaNigeriaNorth AmericaNorth MacedoniaNorthern AfricaNorthern EuropeNorwayOceaniaPakistanPanamaPeruPhilippinesPolandPortugalRomaniaRussiaSaudi ArabiaScotlandSenegalSerbiaSierra LeoneSingaporeSomaliaSouth AfricaSouth AmericaSouth Central AsiaSouth Eastern AsiaSouthern EuropeSpainSri LankaSt. Vincent and the GrenadinesSudanSwedenSwitzerlandSyriaTaiwanThailandTrinidad and TobagoTurkeyUgandaUkraineUruguayUzbekistanVenezuelaVietnamWest IndiesWestern AfricaWestern AsiaWestern EuropeYemenZaireZimbabweAzores
Child Poverty Among Boys Under 16
Income
Poverty
Unemployment
Labor Participation
Family Structure
Vehicle Availability
Education Level
Disability

Child Poverty Among Boys Under 16 Comparison

Burmese

Immigrants from Norway

Exceptional
Exceptional
13.0%
CHILD POVERTY AMONG BOYS UNDER 16
99.9/ 100
METRIC RATING
12th/ 347
METRIC RANK
15.3%
CHILD POVERTY AMONG BOYS UNDER 16
92.3/ 100
METRIC RATING
123rd/ 347
METRIC RANK

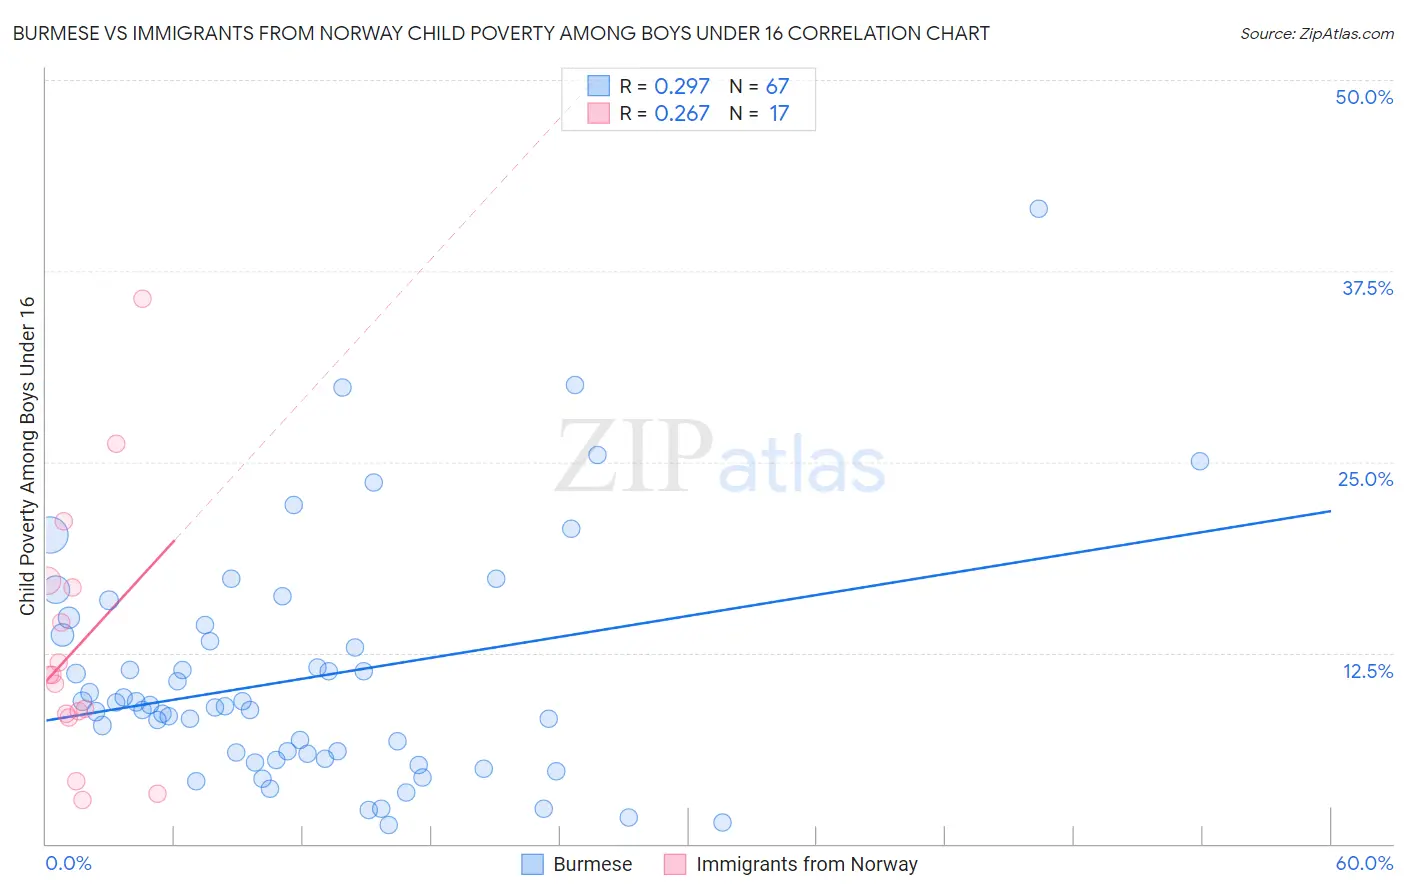
Burmese vs Immigrants from Norway Child Poverty Among Boys Under 16 Correlation Chart

The statistical analysis conducted on geographies consisting of 454,977,536 people shows a weak positive correlation between the proportion of Burmese and poverty level among boys under the age of 16 in the United States with a correlation coefficient (R) of 0.297 and weighted average of 13.0%. Similarly, the statistical analysis conducted on geographies consisting of 115,648,610 people shows a weak positive correlation between the proportion of Immigrants from Norway and poverty level among boys under the age of 16 in the United States with a correlation coefficient (R) of 0.267 and weighted average of 15.3%, a difference of 17.9%.
Burmese vs Immigrants from Norway Child Poverty Among Boys Under 16

Child Poverty Among Boys Under 16 Correlation Summary

MeasurementBurmeseImmigrants from Norway
Minimum1.2%2.9%
Maximum41.5%35.7%
Range40.3%32.8%
Mean10.9%13.0%
Median9.0%11.0%
Interquartile 25% (IQ1)5.6%8.4%
Interquartile 75% (IQ3)13.7%17.0%
Interquartile Range (IQR)8.1%8.6%
Standard Deviation (Sample)7.7%8.5%
Standard Deviation (Population)7.6%8.3%

Similar Demographics by Child Poverty Among Boys Under 16

Demographics Similar to Burmese by Child Poverty Among Boys Under 16

In terms of child poverty among boys under 16, the demographic groups most similar to Burmese are Immigrants from Korea (13.0%, a difference of 0.50%), Immigrants from Ireland (13.1%, a difference of 1.2%), Immigrants from Japan (13.1%, a difference of 1.3%), Maltese (13.2%, a difference of 1.6%), and Norwegian (13.2%, a difference of 1.7%).
DemographicsRating | RankChild Poverty Among Boys Under 16
Chinese
100.0
/100
|
#5
Exceptional
11.9%
Immigrants | Hong Kong
100.0
/100
|
#6
Exceptional
12.3%
Iranians
100.0
/100
|
#7
Exceptional
12.4%
Immigrants | Singapore
100.0
/100
|
#8
Exceptional
12.5%
Immigrants | Iran
100.0
/100
|
#9
Exceptional
12.5%
Bhutanese
100.0
/100
|
#10
Exceptional
12.6%
Immigrants | South Central Asia
100.0
/100
|
#11
Exceptional
12.7%
Burmese
99.9
/100
|
#12
Exceptional
13.0%
Immigrants | Korea
99.9
/100
|
#13
Exceptional
13.0%
Immigrants | Ireland
99.9
/100
|
#14
Exceptional
13.1%
Immigrants | Japan
99.9
/100
|
#15
Exceptional
13.1%
Maltese
99.9
/100
|
#16
Exceptional
13.2%
Norwegians
99.9
/100
|
#17
Exceptional
13.2%
Bulgarians
99.9
/100
|
#18
Exceptional
13.3%
Bolivians
99.9
/100
|
#19
Exceptional
13.3%

Demographics Similar to Immigrants from Norway by Child Poverty Among Boys Under 16

In terms of child poverty among boys under 16, the demographic groups most similar to Immigrants from Norway are Tlingit-Haida (15.3%, a difference of 0.010%), Czechoslovakian (15.3%, a difference of 0.080%), Immigrants from Malaysia (15.3%, a difference of 0.22%), Scottish (15.2%, a difference of 0.32%), and South African (15.2%, a difference of 0.33%).
DemographicsRating | RankChild Poverty Among Boys Under 16
Immigrants | South Eastern Asia
93.5
/100
|
#116
Exceptional
15.2%
Immigrants | Vietnam
93.5
/100
|
#117
Exceptional
15.2%
Native Hawaiians
93.4
/100
|
#118
Exceptional
15.2%
Belgians
93.1
/100
|
#119
Exceptional
15.2%
South Africans
93.0
/100
|
#120
Exceptional
15.2%
Scottish
93.0
/100
|
#121
Exceptional
15.2%
Immigrants | Malaysia
92.8
/100
|
#122
Exceptional
15.3%
Immigrants | Norway
92.3
/100
|
#123
Exceptional
15.3%
Tlingit-Haida
92.2
/100
|
#124
Exceptional
15.3%
Czechoslovakians
92.1
/100
|
#125
Exceptional
15.3%
Palestinians
91.3
/100
|
#126
Exceptional
15.4%
Carpatho Rusyns
91.1
/100
|
#127
Exceptional
15.4%
Canadians
90.6
/100
|
#128
Exceptional
15.4%
Immigrants | Brazil
90.3
/100
|
#129
Exceptional
15.4%
Mongolians
90.2
/100
|
#130
Exceptional
15.4%