Bulgarian vs Immigrants from Middle Africa Seniors Poverty Over the Age of 75

COMPARE

Bulgarian
Race
Ancestry
AfghanAfricanAlaska NativeAlaskan AthabascanAlbanianAleutAlsatianAmericanApacheArabArapahoArgentineanArmenianAssyrian/Chaldean/SyriacAustralianAustrianBahamianBangladeshiBarbadianBasqueBelgianBelizeanBermudanBhutaneseBlackfeetBolivianBrazilianBritishBritish West IndianBulgarianBurmeseCajunCambodianCanadianCape VerdeanCarpatho RusynCelticCentral AmericanCentral American IndianCherokeeCheyenneChickasawChileanChineseChippewaChoctawColombianColvilleComancheCosta RicanCreeCreekCroatianCrowCubanCypriotCzechCzechoslovakianDanishDelawareDominicanDutchDutch West IndianEastern EuropeanEcuadorianEgyptianEnglishEstonianEthiopianEuropeanFijianFilipinoFinnishFrenchFrench American IndianFrench CanadianGermanGerman RussianGhanaianGreekGuamanian/ChamorroGuatemalanGuyaneseHaitianHmongHonduranHopiHoumaHungarianIcelanderIndian (Asian)IndonesianInupiatIranianIraqiIrishIroquoisIsraeliItalianJamaicanJapaneseJordanianKenyanKiowaKoreanLaotianLatvianLebaneseLiberianLithuanianLumbeeLuxembourgerMacedonianMalaysianMalteseMarshalleseMenomineeMexicanMexican American IndianMongolianMoroccanNative HawaiianNavajoNepaleseNew ZealanderNicaraguanNigerianNorthern EuropeanNorwegianOkinawanOsageOttawaPaiutePakistaniPalestinianPanamanianParaguayanPennsylvania GermanPeruvianPimaPolishPortuguesePotawatomiPuebloPuerto RicanPuget Sound SalishRomanianRussianSalvadoranSamoanScandinavianScotch-IrishScottishSeminoleSenegaleseSerbianShoshoneSierra LeoneanSiouxSlavicSlovakSloveneSomaliSouth AfricanSouth AmericanSouth American IndianSoviet UnionSpaniardSpanishSpanish AmericanSpanish American IndianSri LankanSubsaharan AfricanSudaneseSwedishSwissSyrianTaiwaneseThaiTlingit-HaidaTohono O'OdhamTonganTrinidadian and TobagonianTsimshianTurkishU.S. Virgin IslanderUgandanUkrainianUruguayanUteVenezuelanVietnameseWelshWest IndianYakamaYaquiYugoslavianYumanYup'ikZimbabwean
Immigration
NonimmigrantsImmigrantsAfghanistanAfricaAlbaniaArgentinaArmeniaAsiaAustraliaAustriaBahamasBangladeshBarbadosBelarusBelgiumBelizeBoliviaBosnia and HerzegovinaBrazilBulgariaBurma/MyanmarCabo VerdeCambodiaCameroonCanadaCaribbeanCentral AmericaChileChinaColombiaCongoCosta RicaCroatiaCubaCzechoslovakiaDenmarkDominicaDominican RepublicEastern AfricaEastern AsiaEastern EuropeEcuadorEgyptEl SalvadorEnglandEritreaEthiopiaEuropeFijiFranceGermanyGhanaGreeceGrenadaGuatemalaGuyanaHaitiHondurasHong KongHungaryIndiaIndonesiaIranIraqIrelandIsraelItalyJamaicaJapanJordanKazakhstanKenyaKoreaKuwaitLaosLatin AmericaLatviaLebanonLiberiaLithuaniaMalaysiaMexicoMicronesiaMoldovaMoroccoNepalNetherlandsNicaraguaNigeriaNorth AmericaNorth MacedoniaNorthern AfricaNorthern EuropeNorwayOceaniaPakistanPanamaPeruPhilippinesPolandPortugalRomaniaRussiaSaudi ArabiaScotlandSenegalSerbiaSierra LeoneSingaporeSomaliaSouth AfricaSouth AmericaSouth Central AsiaSouth Eastern AsiaSouthern EuropeSpainSri LankaSt. Vincent and the GrenadinesSudanSwedenSwitzerlandSyriaTaiwanThailandTrinidad and TobagoTurkeyUgandaUkraineUruguayUzbekistanVenezuelaVietnamWest IndiesWestern AfricaWestern AsiaWestern EuropeYemenZaireZimbabweAzores
Immigrants from Middle Africa
Race
Ancestry
AfghanAfricanAlaska NativeAlaskan AthabascanAlbanianAleutAlsatianAmericanApacheArabArapahoArgentineanArmenianAssyrian/Chaldean/SyriacAustralianAustrianBahamianBangladeshiBarbadianBasqueBelgianBelizeanBermudanBhutaneseBlackfeetBolivianBrazilianBritishBritish West IndianBurmeseCajunCambodianCanadianCape VerdeanCarpatho RusynCelticCentral AmericanCentral American IndianCherokeeCheyenneChickasawChileanChineseChippewaChoctawColombianColvilleComancheCosta RicanCreeCreekCroatianCrowCubanCypriotCzechCzechoslovakianDanishDelawareDominicanDutchDutch West IndianEastern EuropeanEcuadorianEgyptianEnglishEstonianEthiopianEuropeanFijianFilipinoFinnishFrenchFrench American IndianFrench CanadianGermanGerman RussianGhanaianGreekGuamanian/ChamorroGuatemalanGuyaneseHaitianHmongHonduranHopiHoumaHungarianIcelanderIndian (Asian)IndonesianInupiatIranianIraqiIrishIroquoisIsraeliItalianJamaicanJapaneseJordanianKenyanKiowaKoreanLaotianLatvianLebaneseLiberianLithuanianLumbeeLuxembourgerMacedonianMalaysianMalteseMarshalleseMenomineeMexicanMexican American IndianMongolianMoroccanNative HawaiianNavajoNepaleseNew ZealanderNicaraguanNigerianNorthern EuropeanNorwegianOkinawanOsageOttawaPaiutePakistaniPalestinianPanamanianParaguayanPennsylvania GermanPeruvianPimaPolishPortuguesePotawatomiPuebloPuerto RicanPuget Sound SalishRomanianRussianSalvadoranSamoanScandinavianScotch-IrishScottishSeminoleSenegaleseSerbianShoshoneSierra LeoneanSiouxSlavicSlovakSloveneSomaliSouth AfricanSouth AmericanSouth American IndianSoviet UnionSpaniardSpanishSpanish AmericanSpanish American IndianSri LankanSubsaharan AfricanSudaneseSwedishSwissSyrianTaiwaneseThaiTlingit-HaidaTohono O'OdhamTonganTrinidadian and TobagonianTsimshianTurkishU.S. Virgin IslanderUgandanUkrainianUruguayanUteVenezuelanVietnameseWelshWest IndianYakamaYaquiYugoslavianYumanYup'ikZimbabwean
Immigration
NonimmigrantsImmigrantsAfghanistanAfricaAlbaniaArgentinaArmeniaAsiaAustraliaAustriaBahamasBangladeshBarbadosBelarusBelgiumBelizeBoliviaBosnia and HerzegovinaBrazilBulgariaBurma/MyanmarCabo VerdeCambodiaCameroonCanadaCaribbeanCentral AmericaChileChinaColombiaCongoCosta RicaCroatiaCubaCzechoslovakiaDenmarkDominicaDominican RepublicEastern AfricaEastern AsiaEastern EuropeEcuadorEgyptEl SalvadorEnglandEritreaEthiopiaEuropeFijiFranceGermanyGhanaGreeceGrenadaGuatemalaGuyanaHaitiHondurasHong KongHungaryIndiaIndonesiaIranIraqIrelandIsraelItalyJamaicaJapanJordanKazakhstanKenyaKoreaKuwaitLaosLatin AmericaLatviaLebanonLiberiaLithuaniaMalaysiaMexicoMicronesiaMiddle AfricaMoldovaMoroccoNepalNetherlandsNicaraguaNigeriaNorth AmericaNorth MacedoniaNorthern AfricaNorthern EuropeNorwayOceaniaPakistanPanamaPeruPhilippinesPolandPortugalRomaniaRussiaSaudi ArabiaScotlandSenegalSerbiaSierra LeoneSingaporeSomaliaSouth AfricaSouth AmericaSouth Central AsiaSouth Eastern AsiaSouthern EuropeSpainSri LankaSt. Vincent and the GrenadinesSudanSwedenSwitzerlandSyriaTaiwanThailandTrinidad and TobagoTurkeyUgandaUkraineUruguayUzbekistanVenezuelaVietnamWest IndiesWestern AfricaWestern AsiaWestern EuropeYemenZaireZimbabweAzores
Seniors Poverty Over the Age of 75
Income
Poverty
Unemployment
Labor Participation
Family Structure
Vehicle Availability
Education Level
Disability

Seniors Poverty Over the Age of 75 Comparison

Bulgarians

Immigrants from Middle Africa

Exceptional
Good
10.7%
SENIORS POVERTY OVER THE AGE OF 75
99.8/ 100
METRIC RATING
26th/ 347
METRIC RANK
12.1%
SENIORS POVERTY OVER THE AGE OF 75
61.2/ 100
METRIC RATING
159th/ 347
METRIC RANK

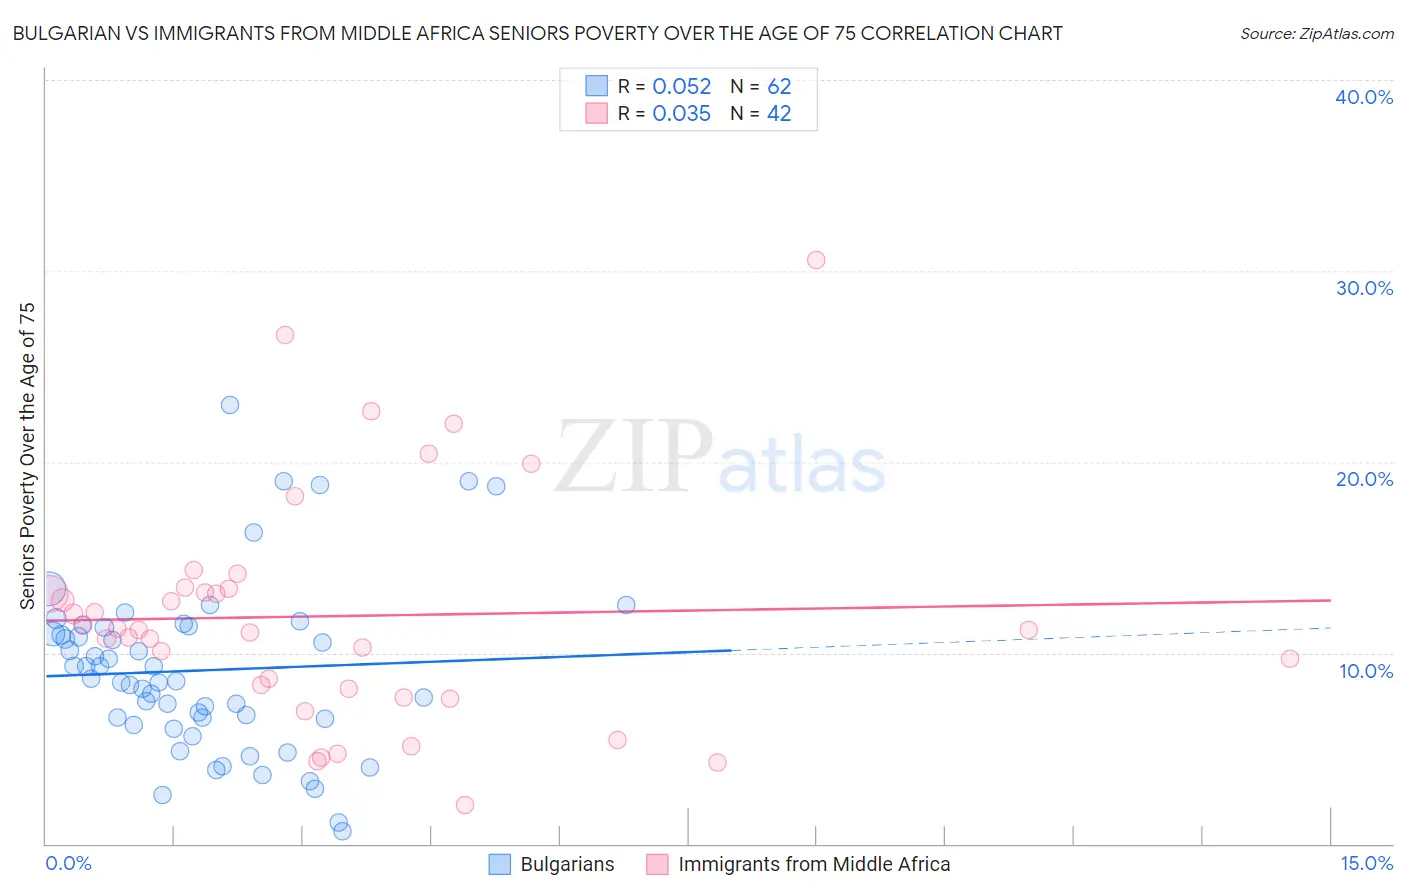
Bulgarian vs Immigrants from Middle Africa Seniors Poverty Over the Age of 75 Correlation Chart

The statistical analysis conducted on geographies consisting of 204,615,916 people shows a slight positive correlation between the proportion of Bulgarians and poverty level among seniors over the age of 75 in the United States with a correlation coefficient (R) of 0.052 and weighted average of 10.7%. Similarly, the statistical analysis conducted on geographies consisting of 201,532,689 people shows no correlation between the proportion of Immigrants from Middle Africa and poverty level among seniors over the age of 75 in the United States with a correlation coefficient (R) of 0.035 and weighted average of 12.1%, a difference of 13.4%.
Bulgarian vs Immigrants from Middle Africa Seniors Poverty Over the Age of 75

Seniors Poverty Over the Age of 75 Correlation Summary

MeasurementBulgarianImmigrants from Middle Africa
Minimum0.68%2.1%
Maximum23.0%30.6%
Range22.3%28.5%
Mean9.1%11.9%
Median8.6%11.2%
Interquartile 25% (IQ1)6.5%8.1%
Interquartile 75% (IQ3)11.3%13.4%
Interquartile Range (IQR)4.8%5.2%
Standard Deviation (Sample)4.5%6.1%
Standard Deviation (Population)4.5%6.0%

Similar Demographics by Seniors Poverty Over the Age of 75

Demographics Similar to Bulgarians by Seniors Poverty Over the Age of 75

In terms of seniors poverty over the age of 75, the demographic groups most similar to Bulgarians are Northern European (10.7%, a difference of 0.27%), Irish (10.7%, a difference of 0.33%), Assyrian/Chaldean/Syriac (10.7%, a difference of 0.48%), Swiss (10.7%, a difference of 0.56%), and Menominee (10.6%, a difference of 0.58%).
DemographicsRating | RankSeniors Poverty Over the Age of 75
Immigrants | Scotland
99.9
/100
|
#19
Exceptional
10.5%
Czechs
99.9
/100
|
#20
Exceptional
10.5%
Slovenes
99.9
/100
|
#21
Exceptional
10.6%
Bhutanese
99.8
/100
|
#22
Exceptional
10.6%
Lithuanians
99.8
/100
|
#23
Exceptional
10.6%
Poles
99.8
/100
|
#24
Exceptional
10.6%
Menominee
99.8
/100
|
#25
Exceptional
10.6%
Bulgarians
99.8
/100
|
#26
Exceptional
10.7%
Northern Europeans
99.8
/100
|
#27
Exceptional
10.7%
Irish
99.8
/100
|
#28
Exceptional
10.7%
Assyrians/Chaldeans/Syriacs
99.8
/100
|
#29
Exceptional
10.7%
Swiss
99.7
/100
|
#30
Exceptional
10.7%
Marshallese
99.7
/100
|
#31
Exceptional
10.7%
British
99.7
/100
|
#32
Exceptional
10.7%
Puget Sound Salish
99.7
/100
|
#33
Exceptional
10.8%

Demographics Similar to Immigrants from Middle Africa by Seniors Poverty Over the Age of 75

In terms of seniors poverty over the age of 75, the demographic groups most similar to Immigrants from Middle Africa are Portuguese (12.1%, a difference of 0.010%), Immigrants from Eastern Africa (12.1%, a difference of 0.030%), Immigrants from Sudan (12.1%, a difference of 0.040%), Immigrants from Norway (12.1%, a difference of 0.050%), and Immigrants from Serbia (12.1%, a difference of 0.080%).
DemographicsRating | RankSeniors Poverty Over the Age of 75
Immigrants | Korea
65.5
/100
|
#152
Good
12.0%
Immigrants | Turkey
64.7
/100
|
#153
Good
12.0%
Cambodians
64.0
/100
|
#154
Good
12.0%
Indonesians
62.6
/100
|
#155
Good
12.1%
Immigrants | Burma/Myanmar
62.3
/100
|
#156
Good
12.1%
Immigrants | Sudan
61.7
/100
|
#157
Good
12.1%
Portuguese
61.3
/100
|
#158
Good
12.1%
Immigrants | Middle Africa
61.2
/100
|
#159
Good
12.1%
Immigrants | Eastern Africa
60.9
/100
|
#160
Good
12.1%
Immigrants | Norway
60.6
/100
|
#161
Good
12.1%
Immigrants | Serbia
60.2
/100
|
#162
Good
12.1%
Immigrants | Greece
58.2
/100
|
#163
Average
12.1%
Potawatomi
57.4
/100
|
#164
Average
12.1%
Okinawans
56.3
/100
|
#165
Average
12.1%
Egyptians
54.8
/100
|
#166
Average
12.1%