British West Indian vs Ottawa Seniors Poverty Over the Age of 65
COMPARE
British West Indian
Ottawa
Seniors Poverty Over the Age of 65
Seniors Poverty Over the Age of 65 Comparison
British West Indians
Ottawa
15.6%
SENIORS POVERTY OVER THE AGE OF 65
0.0/ 100
METRIC RATING
331st/ 347
METRIC RANK
10.4%
SENIORS POVERTY OVER THE AGE OF 65
88.5/ 100
METRIC RATING
128th/ 347
METRIC RANK
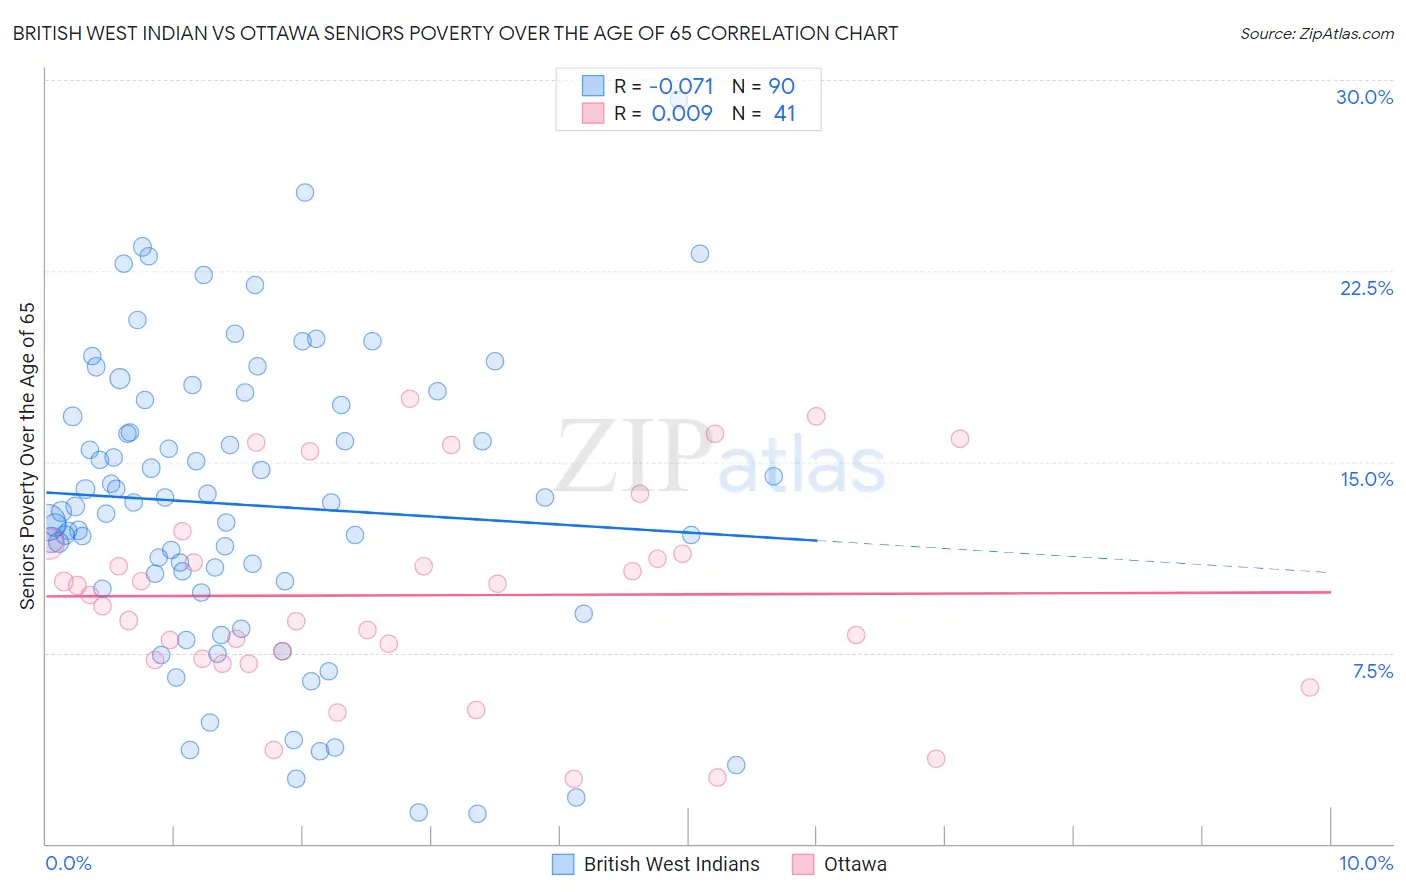
British West Indian vs Ottawa Seniors Poverty Over the Age of 65 Correlation Chart
The statistical analysis conducted on geographies consisting of 152,431,977 people shows a slight negative correlation between the proportion of British West Indians and poverty level among seniors over the age of 65 in the United States with a correlation coefficient (R) of -0.071 and weighted average of 15.6%. Similarly, the statistical analysis conducted on geographies consisting of 49,903,467 people shows no correlation between the proportion of Ottawa and poverty level among seniors over the age of 65 in the United States with a correlation coefficient (R) of 0.009 and weighted average of 10.4%, a difference of 49.4%.
Seniors Poverty Over the Age of 65 Correlation Summary
| Measurement | British West Indian | Ottawa |
| Minimum | 1.2% | 2.6% |
| Maximum | 29.2% | 17.5% |
| Range | 28.0% | 14.9% |
| Mean | 13.3% | 9.8% |
| Median | 13.3% | 9.8% |
| Interquartile 25% (IQ1) | 10.3% | 7.2% |
| Interquartile 75% (IQ3) | 17.3% | 11.6% |
| Interquartile Range (IQR) | 6.9% | 4.3% |
| Standard Deviation (Sample) | 5.8% | 3.9% |
| Standard Deviation (Population) | 5.8% | 3.9% |
Similar Demographics by Seniors Poverty Over the Age of 65
Demographics Similar to British West Indians by Seniors Poverty Over the Age of 65
In terms of seniors poverty over the age of 65, the demographic groups most similar to British West Indians are Immigrants from St. Vincent and the Grenadines (15.5%, a difference of 0.51%), Immigrants from Dominica (15.5%, a difference of 0.81%), Immigrants from Grenada (15.8%, a difference of 1.4%), Immigrants from Yemen (15.9%, a difference of 1.8%), and Sioux (15.3%, a difference of 1.9%).
| Demographics | Rating | Rank | Seniors Poverty Over the Age of 65 |
| Nicaraguans | 0.0 /100 | #324 | Tragic 15.0% |
| Central American Indians | 0.0 /100 | #325 | Tragic 15.1% |
| Immigrants | Armenia | 0.0 /100 | #326 | Tragic 15.2% |
| Crow | 0.0 /100 | #327 | Tragic 15.2% |
| Sioux | 0.0 /100 | #328 | Tragic 15.3% |
| Immigrants | Dominica | 0.0 /100 | #329 | Tragic 15.5% |
| Immigrants | St. Vincent and the Grenadines | 0.0 /100 | #330 | Tragic 15.5% |
| British West Indians | 0.0 /100 | #331 | Tragic 15.6% |
| Immigrants | Grenada | 0.0 /100 | #332 | Tragic 15.8% |
| Immigrants | Yemen | 0.0 /100 | #333 | Tragic 15.9% |
| Immigrants | Nicaragua | 0.0 /100 | #334 | Tragic 15.9% |
| Cubans | 0.0 /100 | #335 | Tragic 16.1% |
| Immigrants | Cabo Verde | 0.0 /100 | #336 | Tragic 16.2% |
| Immigrants | Caribbean | 0.0 /100 | #337 | Tragic 16.5% |
| Pueblo | 0.0 /100 | #338 | Tragic 17.2% |
Demographics Similar to Ottawa by Seniors Poverty Over the Age of 65
In terms of seniors poverty over the age of 65, the demographic groups most similar to Ottawa are Immigrants from Iran (10.4%, a difference of 0.020%), Immigrants from Oceania (10.4%, a difference of 0.020%), Immigrants from Hungary (10.4%, a difference of 0.13%), Cambodian (10.4%, a difference of 0.13%), and Egyptian (10.5%, a difference of 0.17%).
| Demographics | Rating | Rank | Seniors Poverty Over the Age of 65 |
| Immigrants | Iraq | 90.7 /100 | #121 | Exceptional 10.4% |
| Immigrants | Moldova | 90.7 /100 | #122 | Exceptional 10.4% |
| Hmong | 90.0 /100 | #123 | Exceptional 10.4% |
| Asians | 89.9 /100 | #124 | Excellent 10.4% |
| Immigrants | Philippines | 89.4 /100 | #125 | Excellent 10.4% |
| Immigrants | Hungary | 89.1 /100 | #126 | Excellent 10.4% |
| Cambodians | 89.1 /100 | #127 | Excellent 10.4% |
| Ottawa | 88.5 /100 | #128 | Excellent 10.4% |
| Immigrants | Iran | 88.4 /100 | #129 | Excellent 10.4% |
| Immigrants | Oceania | 88.4 /100 | #130 | Excellent 10.4% |
| Egyptians | 87.8 /100 | #131 | Excellent 10.5% |
| Immigrants | Turkey | 87.7 /100 | #132 | Excellent 10.5% |
| Guamanians/Chamorros | 87.5 /100 | #133 | Excellent 10.5% |
| Sierra Leoneans | 86.8 /100 | #134 | Excellent 10.5% |
| Immigrants | Norway | 86.5 /100 | #135 | Excellent 10.5% |