British West Indian vs Immigrants from El Salvador Single Male Poverty
COMPARE
British West Indian
Immigrants from El Salvador
Single Male Poverty
Single Male Poverty Comparison
British West Indians
Immigrants from El Salvador
13.4%
SINGLE MALE POVERTY
3.4/ 100
METRIC RATING
237th/ 347
METRIC RANK
12.6%
SINGLE MALE POVERTY
80.0/ 100
METRIC RATING
138th/ 347
METRIC RANK
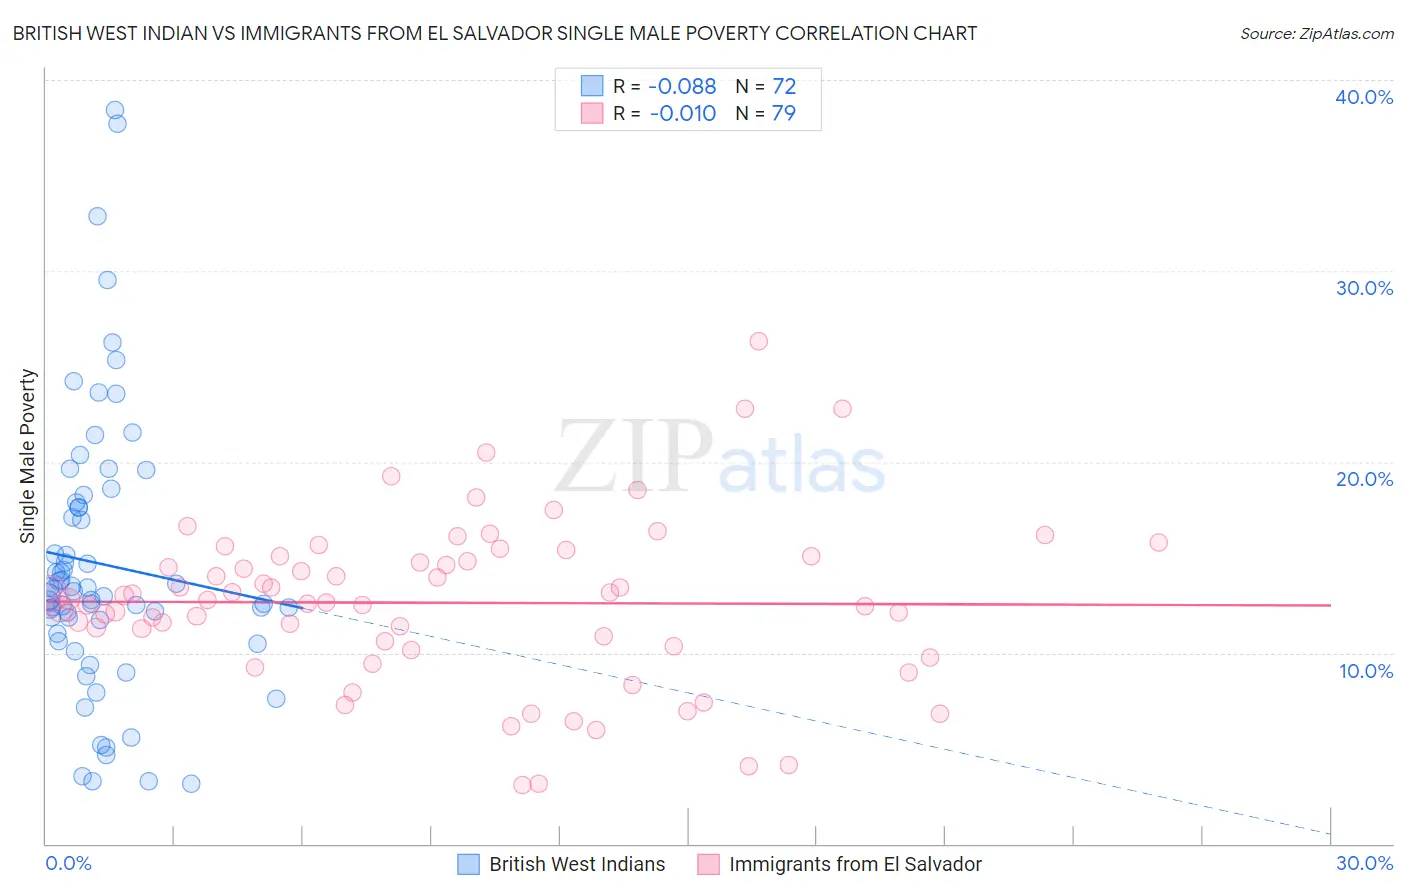
British West Indian vs Immigrants from El Salvador Single Male Poverty Correlation Chart
The statistical analysis conducted on geographies consisting of 145,852,012 people shows a slight negative correlation between the proportion of British West Indians and poverty level among single males in the United States with a correlation coefficient (R) of -0.088 and weighted average of 13.4%. Similarly, the statistical analysis conducted on geographies consisting of 325,623,225 people shows no correlation between the proportion of Immigrants from El Salvador and poverty level among single males in the United States with a correlation coefficient (R) of -0.010 and weighted average of 12.6%, a difference of 6.4%.
Single Male Poverty Correlation Summary
| Measurement | British West Indian | Immigrants from El Salvador |
| Minimum | 3.1% | 3.1% |
| Maximum | 38.5% | 26.3% |
| Range | 35.3% | 23.3% |
| Mean | 14.6% | 12.6% |
| Median | 13.3% | 12.8% |
| Interquartile 25% (IQ1) | 11.3% | 10.3% |
| Interquartile 75% (IQ3) | 17.8% | 15.1% |
| Interquartile Range (IQR) | 6.4% | 4.7% |
| Standard Deviation (Sample) | 7.2% | 4.3% |
| Standard Deviation (Population) | 7.2% | 4.3% |
Similar Demographics by Single Male Poverty
Demographics Similar to British West Indians by Single Male Poverty
In terms of single male poverty, the demographic groups most similar to British West Indians are Luxembourger (13.4%, a difference of 0.060%), Immigrants from Ghana (13.4%, a difference of 0.10%), Bangladeshi (13.3%, a difference of 0.11%), Czechoslovakian (13.4%, a difference of 0.18%), and British (13.3%, a difference of 0.21%).
| Demographics | Rating | Rank | Single Male Poverty |
| Ghanaians | 6.1 /100 | #230 | Tragic 13.3% |
| Slavs | 5.3 /100 | #231 | Tragic 13.3% |
| Immigrants | Caribbean | 5.0 /100 | #232 | Tragic 13.3% |
| British | 4.0 /100 | #233 | Tragic 13.3% |
| Canadians | 4.0 /100 | #234 | Tragic 13.3% |
| Bangladeshis | 3.7 /100 | #235 | Tragic 13.3% |
| Luxembourgers | 3.6 /100 | #236 | Tragic 13.4% |
| British West Indians | 3.4 /100 | #237 | Tragic 13.4% |
| Immigrants | Ghana | 3.2 /100 | #238 | Tragic 13.4% |
| Czechoslovakians | 3.0 /100 | #239 | Tragic 13.4% |
| Belizeans | 2.3 /100 | #240 | Tragic 13.4% |
| Immigrants | Germany | 2.1 /100 | #241 | Tragic 13.4% |
| Carpatho Rusyns | 2.1 /100 | #242 | Tragic 13.4% |
| Barbadians | 2.1 /100 | #243 | Tragic 13.4% |
| Immigrants | Senegal | 1.7 /100 | #244 | Tragic 13.5% |
Demographics Similar to Immigrants from El Salvador by Single Male Poverty
In terms of single male poverty, the demographic groups most similar to Immigrants from El Salvador are Cuban (12.6%, a difference of 0.010%), Ukrainian (12.6%, a difference of 0.060%), Immigrants from Costa Rica (12.5%, a difference of 0.16%), Immigrants from Austria (12.5%, a difference of 0.16%), and Immigrants from Zimbabwe (12.6%, a difference of 0.16%).
| Demographics | Rating | Rank | Single Male Poverty |
| Immigrants | Northern Europe | 83.7 /100 | #131 | Excellent 12.5% |
| Salvadorans | 83.7 /100 | #132 | Excellent 12.5% |
| Immigrants | Western Asia | 83.4 /100 | #133 | Excellent 12.5% |
| Immigrants | Ecuador | 82.1 /100 | #134 | Excellent 12.5% |
| Immigrants | Costa Rica | 81.9 /100 | #135 | Excellent 12.5% |
| Immigrants | Austria | 81.9 /100 | #136 | Excellent 12.5% |
| Ukrainians | 80.7 /100 | #137 | Excellent 12.6% |
| Immigrants | El Salvador | 80.0 /100 | #138 | Excellent 12.6% |
| Cubans | 79.9 /100 | #139 | Good 12.6% |
| Immigrants | Zimbabwe | 78.0 /100 | #140 | Good 12.6% |
| Okinawans | 75.9 /100 | #141 | Good 12.6% |
| Immigrants | Uganda | 75.9 /100 | #142 | Good 12.6% |
| Immigrants | France | 75.8 /100 | #143 | Good 12.6% |
| Hawaiians | 75.1 /100 | #144 | Good 12.6% |
| Immigrants | Lebanon | 75.0 /100 | #145 | Good 12.6% |