British West Indian vs Carpatho Rusyn Child Poverty Under the Age of 5

COMPARE

British West Indian
Race
Ancestry
AfghanAfricanAlaska NativeAlaskan AthabascanAlbanianAleutAlsatianAmericanApacheArabArapahoArgentineanArmenianAssyrian/Chaldean/SyriacAustralianAustrianBahamianBangladeshiBarbadianBasqueBelgianBelizeanBermudanBhutaneseBlackfeetBolivianBrazilianBritishBritish West IndianBulgarianBurmeseCajunCambodianCanadianCape VerdeanCelticCentral AmericanCentral American IndianCherokeeCheyenneChickasawChileanChineseChippewaChoctawColombianColvilleComancheCosta RicanCreeCreekCroatianCrowCubanCypriotCzechCzechoslovakianDanishDelawareDominicanDutchDutch West IndianEastern EuropeanEcuadorianEgyptianEnglishEstonianEthiopianEuropeanFijianFilipinoFinnishFrenchFrench American IndianFrench CanadianGermanGerman RussianGhanaianGreekGuamanian/ChamorroGuatemalanGuyaneseHaitianHmongHonduranHopiHoumaHungarianIcelanderIndian (Asian)IndonesianInupiatIranianIraqiIrishIroquoisIsraeliItalianJamaicanJapaneseJordanianKenyanKiowaKoreanLaotianLatvianLebaneseLiberianLithuanianLumbeeLuxembourgerMacedonianMalaysianMalteseMarshalleseMenomineeMexicanMexican American IndianMongolianMoroccanNative HawaiianNavajoNepaleseNew ZealanderNicaraguanNigerianNorthern EuropeanNorwegianOkinawanOsageOttawaPaiutePakistaniPalestinianPanamanianParaguayanPennsylvania GermanPeruvianPimaPolishPortuguesePotawatomiPuebloPuerto RicanPuget Sound SalishRomanianRussianSalvadoranSamoanScandinavianScotch-IrishScottishSeminoleSenegaleseSerbianShoshoneSierra LeoneanSiouxSlavicSlovakSloveneSomaliSouth AfricanSouth AmericanSouth American IndianSoviet UnionSpaniardSpanishSpanish AmericanSpanish American IndianSri LankanSubsaharan AfricanSudaneseSwedishSwissSyrianTaiwaneseThaiTlingit-HaidaTohono O'OdhamTonganTrinidadian and TobagonianTsimshianTurkishU.S. Virgin IslanderUgandanUkrainianUruguayanUteVenezuelanVietnameseWelshWest IndianYakamaYaquiYugoslavianYumanYup'ikZimbabwean
Immigration
NonimmigrantsImmigrantsAfghanistanAfricaAlbaniaArgentinaArmeniaAsiaAustraliaAustriaBahamasBangladeshBarbadosBelarusBelgiumBelizeBoliviaBosnia and HerzegovinaBrazilBulgariaBurma/MyanmarCabo VerdeCambodiaCameroonCanadaCaribbeanCentral AmericaChileChinaColombiaCongoCosta RicaCroatiaCubaCzechoslovakiaDenmarkDominicaDominican RepublicEastern AfricaEastern AsiaEastern EuropeEcuadorEgyptEl SalvadorEnglandEritreaEthiopiaEuropeFijiFranceGermanyGhanaGreeceGrenadaGuatemalaGuyanaHaitiHondurasHong KongHungaryIndiaIndonesiaIranIraqIrelandIsraelItalyJamaicaJapanJordanKazakhstanKenyaKoreaKuwaitLaosLatin AmericaLatviaLebanonLiberiaLithuaniaMalaysiaMexicoMicronesiaMiddle AfricaMoldovaMoroccoNepalNetherlandsNicaraguaNigeriaNorth AmericaNorth MacedoniaNorthern AfricaNorthern EuropeNorwayOceaniaPakistanPanamaPeruPhilippinesPolandPortugalRomaniaRussiaSaudi ArabiaScotlandSenegalSerbiaSierra LeoneSingaporeSomaliaSouth AfricaSouth AmericaSouth Central AsiaSouth Eastern AsiaSouthern EuropeSpainSri LankaSt. Vincent and the GrenadinesSudanSwedenSwitzerlandSyriaTaiwanThailandTrinidad and TobagoTurkeyUgandaUkraineUruguayUzbekistanVenezuelaVietnamWest IndiesWestern AfricaWestern AsiaWestern EuropeYemenZaireZimbabweAzores
Carpatho Rusyn
Race
Ancestry
AfghanAfricanAlaska NativeAlaskan AthabascanAlbanianAleutAlsatianAmericanApacheArabArapahoArgentineanArmenianAssyrian/Chaldean/SyriacAustralianAustrianBahamianBangladeshiBarbadianBasqueBelgianBelizeanBermudanBhutaneseBlackfeetBolivianBrazilianBritishBulgarianBurmeseCajunCambodianCanadianCape VerdeanCarpatho RusynCelticCentral AmericanCentral American IndianCherokeeCheyenneChickasawChileanChineseChippewaChoctawColombianColvilleComancheCosta RicanCreeCreekCroatianCrowCubanCypriotCzechCzechoslovakianDanishDelawareDominicanDutchDutch West IndianEastern EuropeanEcuadorianEgyptianEnglishEstonianEthiopianEuropeanFijianFilipinoFinnishFrenchFrench American IndianFrench CanadianGermanGerman RussianGhanaianGreekGuamanian/ChamorroGuatemalanGuyaneseHaitianHmongHonduranHopiHoumaHungarianIcelanderIndian (Asian)IndonesianInupiatIranianIraqiIrishIroquoisIsraeliItalianJamaicanJapaneseJordanianKenyanKiowaKoreanLaotianLatvianLebaneseLiberianLithuanianLumbeeLuxembourgerMacedonianMalaysianMalteseMarshalleseMenomineeMexicanMexican American IndianMongolianMoroccanNative HawaiianNavajoNepaleseNew ZealanderNicaraguanNigerianNorthern EuropeanNorwegianOkinawanOsageOttawaPaiutePakistaniPalestinianPanamanianParaguayanPennsylvania GermanPeruvianPimaPolishPortuguesePotawatomiPuebloPuerto RicanPuget Sound SalishRomanianRussianSalvadoranSamoanScandinavianScotch-IrishScottishSeminoleSenegaleseSerbianShoshoneSierra LeoneanSiouxSlavicSlovakSloveneSomaliSouth AfricanSouth AmericanSouth American IndianSoviet UnionSpaniardSpanishSpanish AmericanSpanish American IndianSri LankanSubsaharan AfricanSudaneseSwedishSwissSyrianTaiwaneseThaiTlingit-HaidaTohono O'OdhamTonganTrinidadian and TobagonianTsimshianTurkishU.S. Virgin IslanderUgandanUkrainianUruguayanUteVenezuelanVietnameseWelshWest IndianYakamaYaquiYugoslavianYumanYup'ikZimbabwean
Immigration
NonimmigrantsImmigrantsAfghanistanAfricaAlbaniaArgentinaArmeniaAsiaAustraliaAustriaBahamasBangladeshBarbadosBelarusBelgiumBelizeBoliviaBosnia and HerzegovinaBrazilBulgariaBurma/MyanmarCabo VerdeCambodiaCameroonCanadaCaribbeanCentral AmericaChileChinaColombiaCongoCosta RicaCroatiaCubaCzechoslovakiaDenmarkDominicaDominican RepublicEastern AfricaEastern AsiaEastern EuropeEcuadorEgyptEl SalvadorEnglandEritreaEthiopiaEuropeFijiFranceGermanyGhanaGreeceGrenadaGuatemalaGuyanaHaitiHondurasHong KongHungaryIndiaIndonesiaIranIraqIrelandIsraelItalyJamaicaJapanJordanKazakhstanKenyaKoreaKuwaitLaosLatin AmericaLatviaLebanonLiberiaLithuaniaMalaysiaMexicoMicronesiaMiddle AfricaMoldovaMoroccoNepalNetherlandsNicaraguaNigeriaNorth AmericaNorth MacedoniaNorthern AfricaNorthern EuropeNorwayOceaniaPakistanPanamaPeruPhilippinesPolandPortugalRomaniaRussiaSaudi ArabiaScotlandSenegalSerbiaSierra LeoneSingaporeSomaliaSouth AfricaSouth AmericaSouth Central AsiaSouth Eastern AsiaSouthern EuropeSpainSri LankaSt. Vincent and the GrenadinesSudanSwedenSwitzerlandSyriaTaiwanThailandTrinidad and TobagoTurkeyUgandaUkraineUruguayUzbekistanVenezuelaVietnamWest IndiesWestern AfricaWestern AsiaWestern EuropeYemenZaireZimbabweAzores
Child Poverty Under the Age of 5
Income
Poverty
Unemployment
Labor Participation
Family Structure
Vehicle Availability
Education Level
Disability

Child Poverty Under the Age of 5 Comparison

British West Indians

Carpatho Rusyns

Tragic
Fair
21.4%
CHILD POVERTY UNDER THE AGE OF 5
0.0/ 100
METRIC RATING
291st/ 347
METRIC RANK
17.5%
CHILD POVERTY UNDER THE AGE OF 5
33.6/ 100
METRIC RATING
188th/ 347
METRIC RANK

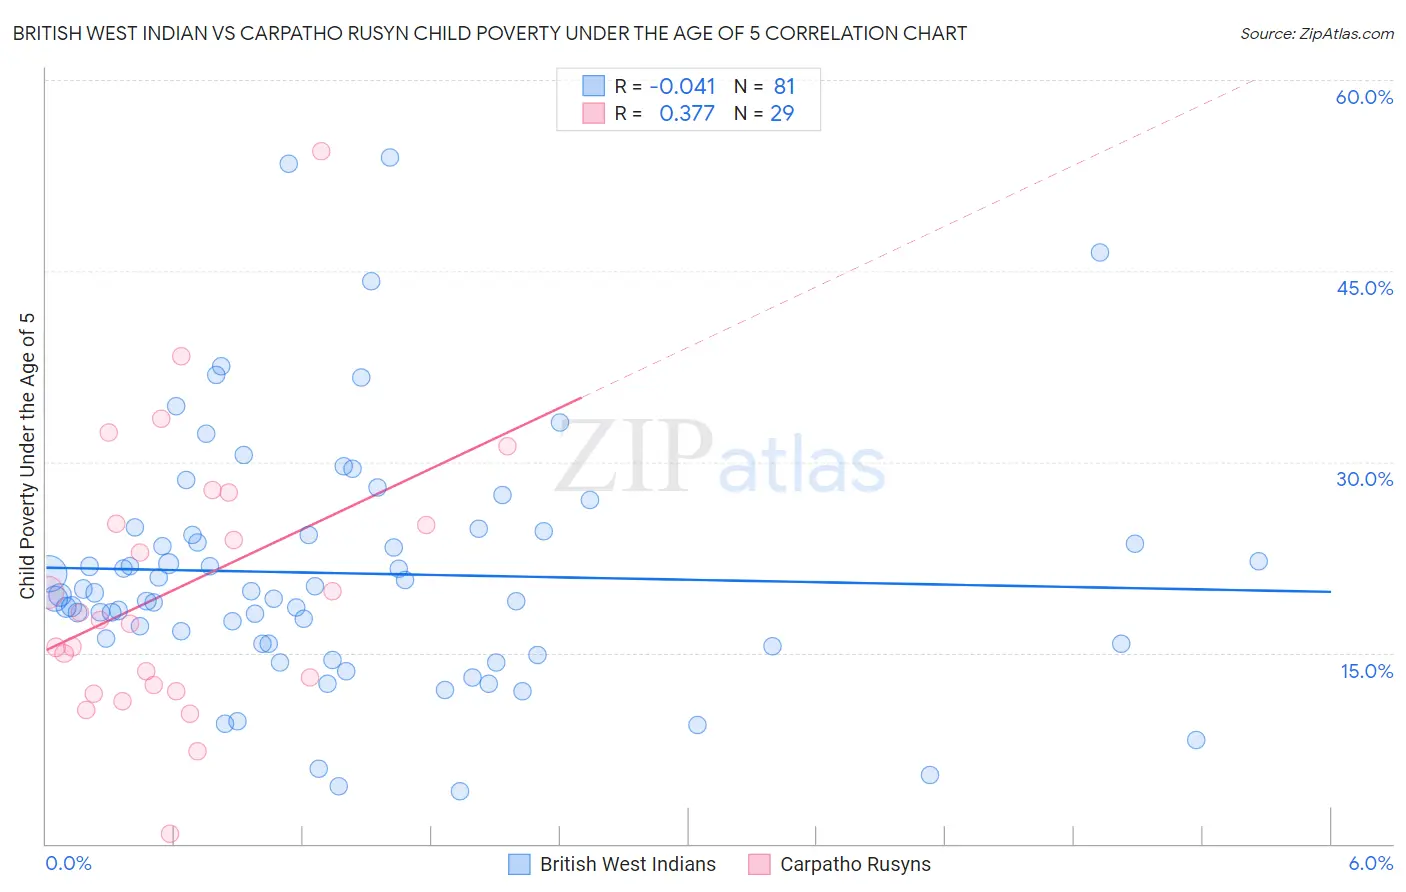
British West Indian vs Carpatho Rusyn Child Poverty Under the Age of 5 Correlation Chart

The statistical analysis conducted on geographies consisting of 150,575,514 people shows no correlation between the proportion of British West Indians and poverty level among children under the age of 5 in the United States with a correlation coefficient (R) of -0.041 and weighted average of 21.4%. Similarly, the statistical analysis conducted on geographies consisting of 57,729,795 people shows a mild positive correlation between the proportion of Carpatho Rusyns and poverty level among children under the age of 5 in the United States with a correlation coefficient (R) of 0.377 and weighted average of 17.5%, a difference of 22.2%.
British West Indian vs Carpatho Rusyn Child Poverty Under the Age of 5

Child Poverty Under the Age of 5 Correlation Summary

MeasurementBritish West IndianCarpatho Rusyn
Minimum4.1%0.75%
Maximum53.9%54.4%
Range49.8%53.6%
Mean21.2%20.1%
Median19.5%17.6%
Interquartile 25% (IQ1)15.7%12.2%
Interquartile 75% (IQ3)24.4%26.4%
Interquartile Range (IQR)8.7%14.1%
Standard Deviation (Sample)9.7%10.9%
Standard Deviation (Population)9.6%10.7%

Similar Demographics by Child Poverty Under the Age of 5

Demographics Similar to British West Indians by Child Poverty Under the Age of 5

In terms of child poverty under the age of 5, the demographic groups most similar to British West Indians are Immigrants from Caribbean (21.4%, a difference of 0.17%), Immigrants from Haiti (21.3%, a difference of 0.58%), Immigrants from Somalia (21.6%, a difference of 0.60%), Immigrants from Senegal (21.3%, a difference of 0.65%), and Immigrants from Zaire (21.3%, a difference of 0.82%).
DemographicsRating | RankChild Poverty Under the Age of 5
Somalis
0.0
/100
|
#284
Tragic
21.1%
Haitians
0.0
/100
|
#285
Tragic
21.2%
Immigrants | Latin America
0.0
/100
|
#286
Tragic
21.2%
Immigrants | Zaire
0.0
/100
|
#287
Tragic
21.3%
Immigrants | Senegal
0.0
/100
|
#288
Tragic
21.3%
Immigrants | Haiti
0.0
/100
|
#289
Tragic
21.3%
Immigrants | Caribbean
0.0
/100
|
#290
Tragic
21.4%
British West Indians
0.0
/100
|
#291
Tragic
21.4%
Immigrants | Somalia
0.0
/100
|
#292
Tragic
21.6%
Mexicans
0.0
/100
|
#293
Tragic
21.6%
Guatemalans
0.0
/100
|
#294
Tragic
21.6%
Cherokee
0.0
/100
|
#295
Tragic
21.7%
Yaqui
0.0
/100
|
#296
Tragic
21.7%
Hispanics or Latinos
0.0
/100
|
#297
Tragic
21.7%
Blackfeet
0.0
/100
|
#298
Tragic
21.8%

Demographics Similar to Carpatho Rusyns by Child Poverty Under the Age of 5

In terms of child poverty under the age of 5, the demographic groups most similar to Carpatho Rusyns are French (17.5%, a difference of 0.010%), Kenyan (17.5%, a difference of 0.12%), Immigrants from Bosnia and Herzegovina (17.5%, a difference of 0.16%), Immigrants from Armenia (17.5%, a difference of 0.49%), and Slovak (17.6%, a difference of 0.53%).
DemographicsRating | RankChild Poverty Under the Age of 5
Immigrants | Germany
41.0
/100
|
#181
Average
17.4%
Arabs
40.7
/100
|
#182
Average
17.4%
Lebanese
40.3
/100
|
#183
Average
17.4%
Immigrants | Costa Rica
39.0
/100
|
#184
Fair
17.4%
Immigrants | Armenia
38.0
/100
|
#185
Fair
17.5%
Immigrants | Bosnia and Herzegovina
35.0
/100
|
#186
Fair
17.5%
Kenyans
34.7
/100
|
#187
Fair
17.5%
Carpatho Rusyns
33.6
/100
|
#188
Fair
17.5%
French
33.6
/100
|
#189
Fair
17.5%
Slovaks
29.2
/100
|
#190
Fair
17.6%
Immigrants | Afghanistan
27.9
/100
|
#191
Fair
17.7%
Immigrants | Uruguay
27.8
/100
|
#192
Fair
17.7%
Immigrants | Uganda
25.0
/100
|
#193
Fair
17.7%
French Canadians
24.6
/100
|
#194
Fair
17.7%
Sierra Leoneans
24.1
/100
|
#195
Fair
17.7%