Brazilian vs Immigrants from Honduras Child Poverty Among Boys Under 16

COMPARE

Brazilian
Race
Ancestry
AfghanAfricanAlaska NativeAlaskan AthabascanAlbanianAleutAlsatianAmericanApacheArabArapahoArgentineanArmenianAssyrian/Chaldean/SyriacAustralianAustrianBahamianBangladeshiBarbadianBasqueBelgianBelizeanBermudanBhutaneseBlackfeetBolivianBrazilianBritishBritish West IndianBulgarianBurmeseCajunCambodianCanadianCape VerdeanCarpatho RusynCelticCentral AmericanCentral American IndianCherokeeCheyenneChickasawChileanChineseChippewaChoctawColombianColvilleComancheCosta RicanCreeCreekCroatianCrowCubanCypriotCzechCzechoslovakianDanishDelawareDominicanDutchDutch West IndianEastern EuropeanEcuadorianEgyptianEnglishEstonianEthiopianEuropeanFijianFilipinoFinnishFrenchFrench American IndianFrench CanadianGermanGerman RussianGhanaianGreekGuamanian/ChamorroGuatemalanGuyaneseHaitianHmongHonduranHopiHoumaHungarianIcelanderIndian (Asian)IndonesianInupiatIranianIraqiIrishIroquoisIsraeliItalianJamaicanJapaneseJordanianKenyanKiowaKoreanLaotianLatvianLebaneseLiberianLithuanianLumbeeLuxembourgerMacedonianMalaysianMalteseMarshalleseMenomineeMexicanMexican American IndianMongolianMoroccanNative HawaiianNavajoNepaleseNew ZealanderNicaraguanNigerianNorthern EuropeanNorwegianOkinawanOsageOttawaPaiutePakistaniPalestinianPanamanianParaguayanPennsylvania GermanPeruvianPimaPolishPortuguesePotawatomiPuebloPuerto RicanPuget Sound SalishRomanianRussianSalvadoranSamoanScandinavianScotch-IrishScottishSeminoleSenegaleseSerbianShoshoneSierra LeoneanSiouxSlavicSlovakSloveneSomaliSouth AfricanSouth AmericanSouth American IndianSoviet UnionSpaniardSpanishSpanish AmericanSpanish American IndianSri LankanSubsaharan AfricanSudaneseSwedishSwissSyrianTaiwaneseThaiTlingit-HaidaTohono O'OdhamTonganTrinidadian and TobagonianTsimshianTurkishU.S. Virgin IslanderUgandanUkrainianUruguayanUteVenezuelanVietnameseWelshWest IndianYakamaYaquiYugoslavianYumanYup'ikZimbabwean
Immigration
NonimmigrantsImmigrantsAfghanistanAfricaAlbaniaArgentinaArmeniaAsiaAustraliaAustriaBahamasBangladeshBarbadosBelarusBelgiumBelizeBoliviaBosnia and HerzegovinaBrazilBulgariaBurma/MyanmarCabo VerdeCambodiaCameroonCanadaCaribbeanCentral AmericaChileChinaColombiaCongoCosta RicaCroatiaCubaCzechoslovakiaDenmarkDominicaDominican RepublicEastern AfricaEastern AsiaEastern EuropeEcuadorEgyptEl SalvadorEnglandEritreaEthiopiaEuropeFijiFranceGermanyGhanaGreeceGrenadaGuatemalaGuyanaHaitiHong KongHungaryIndiaIndonesiaIranIraqIrelandIsraelItalyJamaicaJapanJordanKazakhstanKenyaKoreaKuwaitLaosLatin AmericaLatviaLebanonLiberiaLithuaniaMalaysiaMexicoMicronesiaMiddle AfricaMoldovaMoroccoNepalNetherlandsNicaraguaNigeriaNorth AmericaNorth MacedoniaNorthern AfricaNorthern EuropeNorwayOceaniaPakistanPanamaPeruPhilippinesPolandPortugalRomaniaRussiaSaudi ArabiaScotlandSenegalSerbiaSierra LeoneSingaporeSomaliaSouth AfricaSouth AmericaSouth Central AsiaSouth Eastern AsiaSouthern EuropeSpainSri LankaSt. Vincent and the GrenadinesSudanSwedenSwitzerlandSyriaTaiwanThailandTrinidad and TobagoTurkeyUgandaUkraineUruguayUzbekistanVenezuelaVietnamWest IndiesWestern AfricaWestern AsiaWestern EuropeYemenZaireZimbabweAzores
Immigrants from Honduras
Race
Ancestry
AfghanAfricanAlaska NativeAlaskan AthabascanAlbanianAleutAlsatianAmericanApacheArabArapahoArgentineanArmenianAssyrian/Chaldean/SyriacAustralianAustrianBahamianBangladeshiBarbadianBasqueBelgianBelizeanBermudanBhutaneseBlackfeetBolivianBritishBritish West IndianBulgarianBurmeseCajunCambodianCanadianCape VerdeanCarpatho RusynCelticCentral AmericanCentral American IndianCherokeeCheyenneChickasawChileanChineseChippewaChoctawColombianColvilleComancheCosta RicanCreeCreekCroatianCrowCubanCypriotCzechCzechoslovakianDanishDelawareDominicanDutchDutch West IndianEastern EuropeanEcuadorianEgyptianEnglishEstonianEthiopianEuropeanFijianFilipinoFinnishFrenchFrench American IndianFrench CanadianGermanGerman RussianGhanaianGreekGuamanian/ChamorroGuatemalanGuyaneseHaitianHmongHonduranHopiHoumaHungarianIcelanderIndian (Asian)IndonesianInupiatIranianIraqiIrishIroquoisIsraeliItalianJamaicanJapaneseJordanianKenyanKiowaKoreanLaotianLatvianLebaneseLiberianLithuanianLumbeeLuxembourgerMacedonianMalaysianMalteseMarshalleseMenomineeMexicanMexican American IndianMongolianMoroccanNative HawaiianNavajoNepaleseNew ZealanderNicaraguanNigerianNorthern EuropeanNorwegianOkinawanOsageOttawaPaiutePakistaniPalestinianPanamanianParaguayanPennsylvania GermanPeruvianPimaPolishPortuguesePotawatomiPuebloPuerto RicanPuget Sound SalishRomanianRussianSalvadoranSamoanScandinavianScotch-IrishScottishSeminoleSenegaleseSerbianShoshoneSierra LeoneanSiouxSlavicSlovakSloveneSomaliSouth AfricanSouth AmericanSouth American IndianSoviet UnionSpaniardSpanishSpanish AmericanSpanish American IndianSri LankanSubsaharan AfricanSudaneseSwedishSwissSyrianTaiwaneseThaiTlingit-HaidaTohono O'OdhamTonganTrinidadian and TobagonianTsimshianTurkishU.S. Virgin IslanderUgandanUkrainianUruguayanUteVenezuelanVietnameseWelshWest IndianYakamaYaquiYugoslavianYumanYup'ikZimbabwean
Immigration
NonimmigrantsImmigrantsAfghanistanAfricaAlbaniaArgentinaArmeniaAsiaAustraliaAustriaBahamasBangladeshBarbadosBelarusBelgiumBelizeBoliviaBosnia and HerzegovinaBrazilBulgariaBurma/MyanmarCabo VerdeCambodiaCameroonCanadaCaribbeanCentral AmericaChileChinaColombiaCongoCosta RicaCroatiaCubaCzechoslovakiaDenmarkDominicaDominican RepublicEastern AfricaEastern AsiaEastern EuropeEcuadorEgyptEl SalvadorEnglandEritreaEthiopiaEuropeFijiFranceGermanyGhanaGreeceGrenadaGuatemalaGuyanaHaitiHondurasHong KongHungaryIndiaIndonesiaIranIraqIrelandIsraelItalyJamaicaJapanJordanKazakhstanKenyaKoreaKuwaitLaosLatin AmericaLatviaLebanonLiberiaLithuaniaMalaysiaMexicoMicronesiaMiddle AfricaMoldovaMoroccoNepalNetherlandsNicaraguaNigeriaNorth AmericaNorth MacedoniaNorthern AfricaNorthern EuropeNorwayOceaniaPakistanPanamaPeruPhilippinesPolandPortugalRomaniaRussiaSaudi ArabiaScotlandSenegalSerbiaSierra LeoneSingaporeSomaliaSouth AfricaSouth AmericaSouth Central AsiaSouth Eastern AsiaSouthern EuropeSpainSri LankaSt. Vincent and the GrenadinesSudanSwedenSwitzerlandSyriaTaiwanThailandTrinidad and TobagoTurkeyUgandaUkraineUruguayUzbekistanVenezuelaVietnamWest IndiesWestern AfricaWestern AsiaWestern EuropeYemenZaireZimbabweAzores
Child Poverty Among Boys Under 16
Income
Poverty
Unemployment
Labor Participation
Family Structure
Vehicle Availability
Education Level
Disability

Child Poverty Among Boys Under 16 Comparison

Brazilians

Immigrants from Honduras

Excellent
Tragic
15.8%
CHILD POVERTY AMONG BOYS UNDER 16
81.0/ 100
METRIC RATING
148th/ 347
METRIC RANK
22.8%
CHILD POVERTY AMONG BOYS UNDER 16
0.0/ 100
METRIC RATING
327th/ 347
METRIC RANK

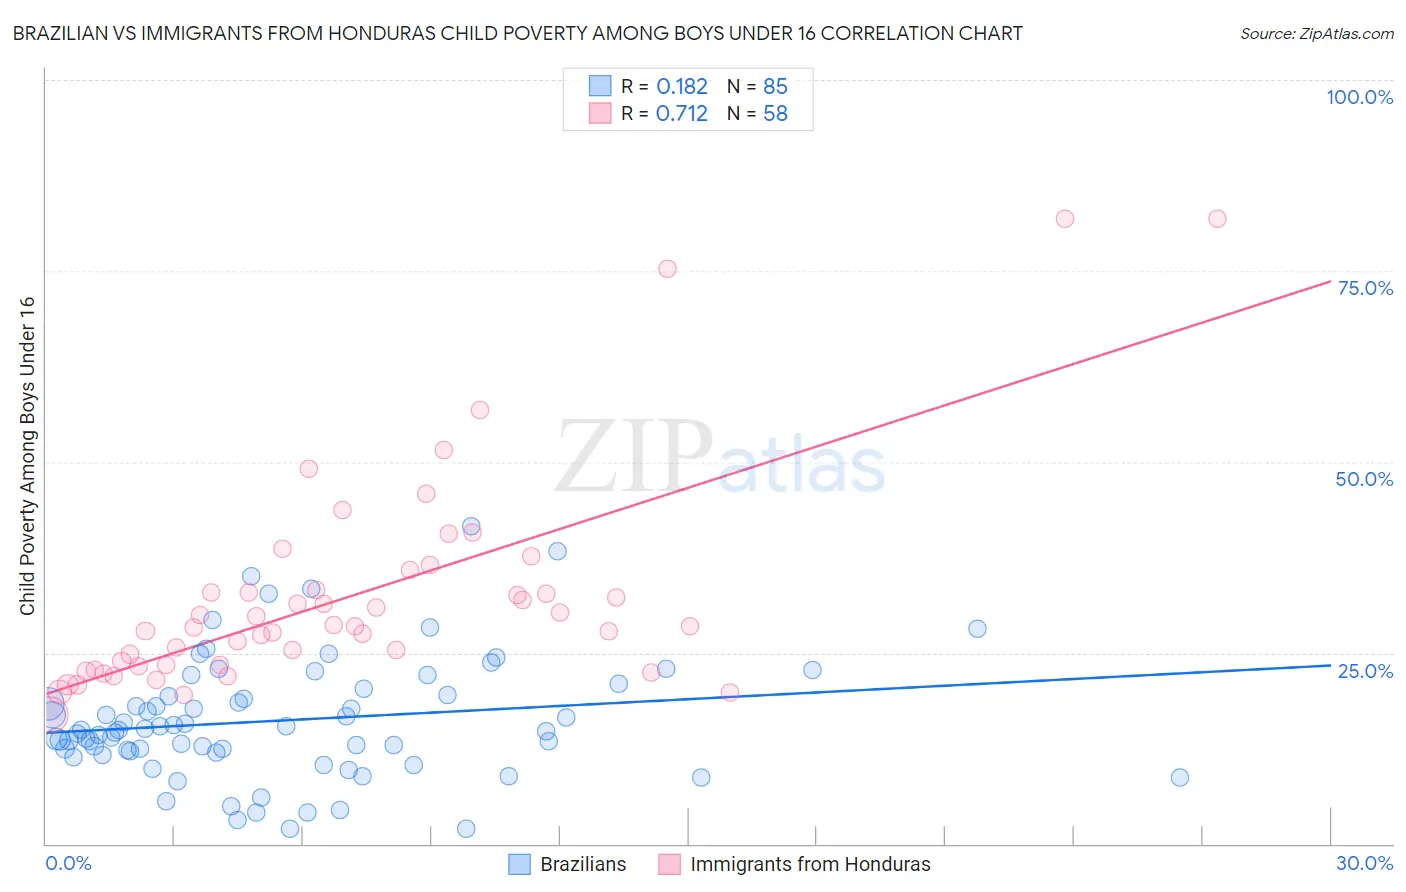
Brazilian vs Immigrants from Honduras Child Poverty Among Boys Under 16 Correlation Chart

The statistical analysis conducted on geographies consisting of 319,230,692 people shows a poor positive correlation between the proportion of Brazilians and poverty level among boys under the age of 16 in the United States with a correlation coefficient (R) of 0.182 and weighted average of 15.8%. Similarly, the statistical analysis conducted on geographies consisting of 320,355,398 people shows a strong positive correlation between the proportion of Immigrants from Honduras and poverty level among boys under the age of 16 in the United States with a correlation coefficient (R) of 0.712 and weighted average of 22.8%, a difference of 44.6%.
Brazilian vs Immigrants from Honduras Child Poverty Among Boys Under 16

Child Poverty Among Boys Under 16 Correlation Summary

MeasurementBrazilianImmigrants from Honduras
Minimum1.9%16.9%
Maximum41.6%81.8%
Range39.6%65.0%
Mean16.2%32.3%
Median14.9%28.4%
Interquartile 25% (IQ1)12.1%23.3%
Interquartile 75% (IQ3)19.9%33.2%
Interquartile Range (IQR)7.8%9.9%
Standard Deviation (Sample)7.9%13.9%
Standard Deviation (Population)7.9%13.8%

Similar Demographics by Child Poverty Among Boys Under 16

Demographics Similar to Brazilians by Child Poverty Among Boys Under 16

In terms of child poverty among boys under 16, the demographic groups most similar to Brazilians are Slovak (15.8%, a difference of 0.14%), Immigrants from Jordan (15.8%, a difference of 0.15%), Venezuelan (15.7%, a difference of 0.20%), Puget Sound Salish (15.8%, a difference of 0.23%), and New Zealander (15.7%, a difference of 0.27%).
DemographicsRating | RankChild Poverty Among Boys Under 16
Slavs
84.5
/100
|
#141
Excellent
15.7%
Immigrants | Hungary
84.1
/100
|
#142
Excellent
15.7%
Immigrants | Fiji
83.6
/100
|
#143
Excellent
15.7%
Immigrants | Peru
83.5
/100
|
#144
Excellent
15.7%
Samoans
83.2
/100
|
#145
Excellent
15.7%
New Zealanders
82.4
/100
|
#146
Excellent
15.7%
Venezuelans
82.1
/100
|
#147
Excellent
15.7%
Brazilians
81.0
/100
|
#148
Excellent
15.8%
Slovaks
80.3
/100
|
#149
Excellent
15.8%
Immigrants | Jordan
80.2
/100
|
#150
Excellent
15.8%
Puget Sound Salish
79.8
/100
|
#151
Good
15.8%
Immigrants | Venezuela
79.5
/100
|
#152
Good
15.8%
French
78.7
/100
|
#153
Good
15.8%
Syrians
77.5
/100
|
#154
Good
15.9%
French Canadians
76.6
/100
|
#155
Good
15.9%

Demographics Similar to Immigrants from Honduras by Child Poverty Among Boys Under 16

In terms of child poverty among boys under 16, the demographic groups most similar to Immigrants from Honduras are Paiute (22.8%, a difference of 0.12%), Central American Indian (22.5%, a difference of 1.3%), Immigrants from Congo (22.4%, a difference of 1.8%), Honduran (22.3%, a difference of 2.1%), and Immigrants from Dominica (22.2%, a difference of 2.7%).
DemographicsRating | RankChild Poverty Among Boys Under 16
U.S. Virgin Islanders
0.0
/100
|
#320
Tragic
22.0%
Cajuns
0.0
/100
|
#321
Tragic
22.2%
Immigrants | Dominica
0.0
/100
|
#322
Tragic
22.2%
Hondurans
0.0
/100
|
#323
Tragic
22.3%
Immigrants | Congo
0.0
/100
|
#324
Tragic
22.4%
Central American Indians
0.0
/100
|
#325
Tragic
22.5%
Paiute
0.0
/100
|
#326
Tragic
22.8%
Immigrants | Honduras
0.0
/100
|
#327
Tragic
22.8%
Pueblo
0.0
/100
|
#328
Tragic
23.5%
Natives/Alaskans
0.0
/100
|
#329
Tragic
24.0%
Colville
0.0
/100
|
#330
Tragic
24.1%
Dominicans
0.0
/100
|
#331
Tragic
24.2%
Immigrants | Dominican Republic
0.0
/100
|
#332
Tragic
24.3%
Apache
0.0
/100
|
#333
Tragic
24.5%
Blacks/African Americans
0.0
/100
|
#334
Tragic
24.5%