Brazilian vs Arab Female Poverty
COMPARE
Brazilian
Arab
Female Poverty
Female Poverty Comparison
Brazilians
Arabs
13.0%
FEMALE POVERTY
80.5/ 100
METRIC RATING
142nd/ 347
METRIC RANK
13.7%
FEMALE POVERTY
28.6/ 100
METRIC RATING
197th/ 347
METRIC RANK
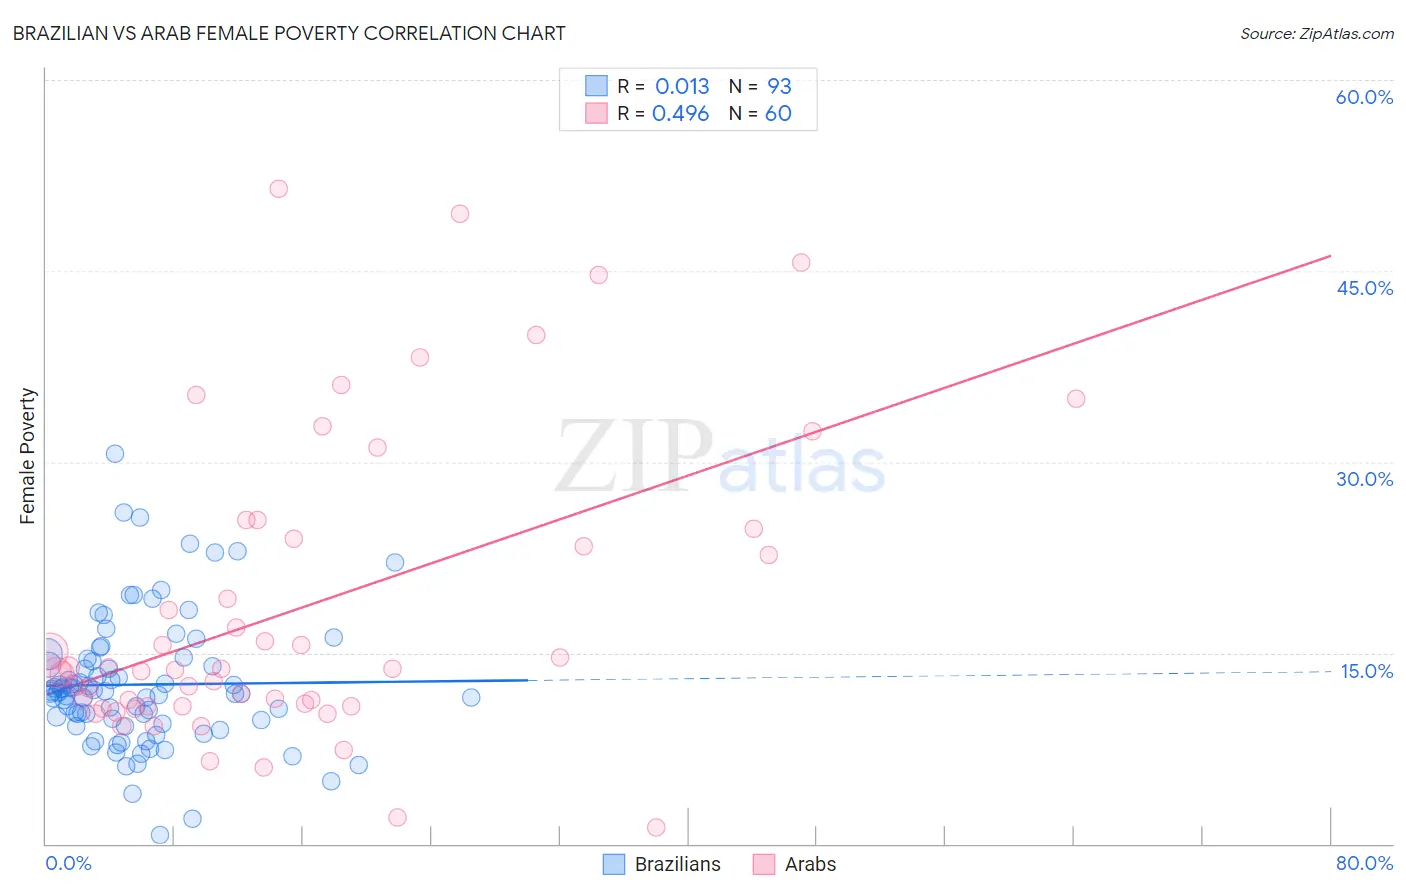
Brazilian vs Arab Female Poverty Correlation Chart
The statistical analysis conducted on geographies consisting of 323,667,111 people shows no correlation between the proportion of Brazilians and poverty level among females in the United States with a correlation coefficient (R) of 0.013 and weighted average of 13.0%. Similarly, the statistical analysis conducted on geographies consisting of 486,246,115 people shows a moderate positive correlation between the proportion of Arabs and poverty level among females in the United States with a correlation coefficient (R) of 0.496 and weighted average of 13.7%, a difference of 5.8%.
Female Poverty Correlation Summary
| Measurement | Brazilian | Arab |
| Minimum | 0.74% | 1.3% |
| Maximum | 30.6% | 51.5% |
| Range | 29.9% | 50.2% |
| Mean | 12.5% | 18.5% |
| Median | 11.9% | 13.7% |
| Interquartile 25% (IQ1) | 9.6% | 10.8% |
| Interquartile 75% (IQ3) | 14.4% | 24.3% |
| Interquartile Range (IQR) | 4.9% | 13.5% |
| Standard Deviation (Sample) | 5.1% | 11.9% |
| Standard Deviation (Population) | 5.1% | 11.8% |
Similar Demographics by Female Poverty
Demographics Similar to Brazilians by Female Poverty
In terms of female poverty, the demographic groups most similar to Brazilians are Immigrants from Malaysia (13.0%, a difference of 0.020%), Icelander (13.0%, a difference of 0.10%), Afghan (13.0%, a difference of 0.11%), Syrian (13.0%, a difference of 0.14%), and Immigrants from Peru (13.0%, a difference of 0.22%).
| Demographics | Rating | Rank | Female Poverty |
| French | 85.6 /100 | #135 | Excellent 12.9% |
| Peruvians | 85.2 /100 | #136 | Excellent 12.9% |
| Chileans | 84.7 /100 | #137 | Excellent 12.9% |
| Immigrants | France | 83.6 /100 | #138 | Excellent 12.9% |
| Basques | 83.1 /100 | #139 | Excellent 12.9% |
| Pakistanis | 83.0 /100 | #140 | Excellent 12.9% |
| Icelanders | 81.1 /100 | #141 | Excellent 13.0% |
| Brazilians | 80.5 /100 | #142 | Excellent 13.0% |
| Immigrants | Malaysia | 80.4 /100 | #143 | Excellent 13.0% |
| Afghans | 79.8 /100 | #144 | Good 13.0% |
| Syrians | 79.6 /100 | #145 | Good 13.0% |
| Immigrants | Peru | 79.1 /100 | #146 | Good 13.0% |
| Immigrants | Kazakhstan | 78.6 /100 | #147 | Good 13.0% |
| Yugoslavians | 76.9 /100 | #148 | Good 13.1% |
| Taiwanese | 75.7 /100 | #149 | Good 13.1% |
Demographics Similar to Arabs by Female Poverty
In terms of female poverty, the demographic groups most similar to Arabs are Immigrants from Uganda (13.7%, a difference of 0.010%), South American Indian (13.7%, a difference of 0.040%), Immigrants from South America (13.7%, a difference of 0.23%), Delaware (13.7%, a difference of 0.29%), and Immigrants from Lebanon (13.8%, a difference of 0.35%).
| Demographics | Rating | Rank | Female Poverty |
| Sierra Leoneans | 33.1 /100 | #190 | Fair 13.7% |
| Immigrants | Kuwait | 32.7 /100 | #191 | Fair 13.7% |
| Immigrants | Costa Rica | 31.9 /100 | #192 | Fair 13.7% |
| Iraqis | 31.8 /100 | #193 | Fair 13.7% |
| Delaware | 31.1 /100 | #194 | Fair 13.7% |
| Immigrants | South America | 30.6 /100 | #195 | Fair 13.7% |
| South American Indians | 28.9 /100 | #196 | Fair 13.7% |
| Arabs | 28.6 /100 | #197 | Fair 13.7% |
| Immigrants | Uganda | 28.5 /100 | #198 | Fair 13.7% |
| Immigrants | Lebanon | 25.6 /100 | #199 | Fair 13.8% |
| Spanish | 21.4 /100 | #200 | Fair 13.9% |
| Immigrants | Kenya | 21.1 /100 | #201 | Fair 13.9% |
| Hmong | 21.1 /100 | #202 | Fair 13.9% |
| Immigrants | Western Asia | 20.7 /100 | #203 | Fair 13.9% |
| Spaniards | 18.9 /100 | #204 | Poor 13.9% |